A back-to-back stem and leaf plot is a method for comparing two data distributions by attaching two sets of ‘leaves’ to the same ‘stem’; for example, the stem-and-leaf plot below displays the distribution of pulse rates of 19 students before and after gentle exercise.
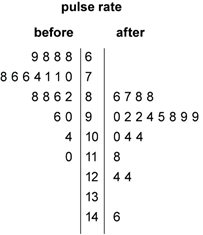
In this plot, the stem unit is ‘10’ and the leaf unit is ‘1’. Thus, the third row in the plot, 8 8 6 2 | 8 | 6 7 8 8, displays pulse rates of 88, 88, 86, 82 before exercise and 86, 87, 88, 88 after exercise.
Bimodal data has two modes.
A binomial is an algebraic expression containing two distinct algebraic terms. For example, \(2x+a\;\) and \(2x+8\;\) are binomial expressions but \(3x+2x\;\) is not, as it can be simplified to \(5x\).
Bivariate data relates to two variables. For example, the arm spans and heights of 16-year-olds or the sex of primary school students and their attitudes toward playing sports.
Bivariate numerical data relates to two numerical variables. For example, height and weight.
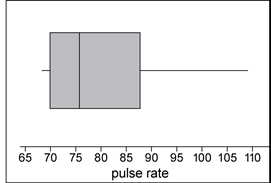
The term box plot is a synonym for a box-and-whisker plot.
A box-and whisker plot is a graphical display of a five-number summary.
In a box-and-whisker plot, the ‘box’ covers the interquartile range (IQR), the middle 50% of scores, with ‘whiskers’ reaching out from each end of the box to indicate maximum and minimum values in the data set. A vertical line in the box is used to indicate the location of the median.
The box-and-whisker plot below has been constructed from the five-number summary of the resting pulse rates of 17 students.