A histogram is a statistical graph for displaying the frequency distribution of continuous data.
A histogram is a graphical representation of the information contained in a frequency table. In a histogram, class frequencies are represented by the areas of rectangles centred on each class interval. The class frequency is proportional to the rectangle’s height when the class intervals are all of equal width.
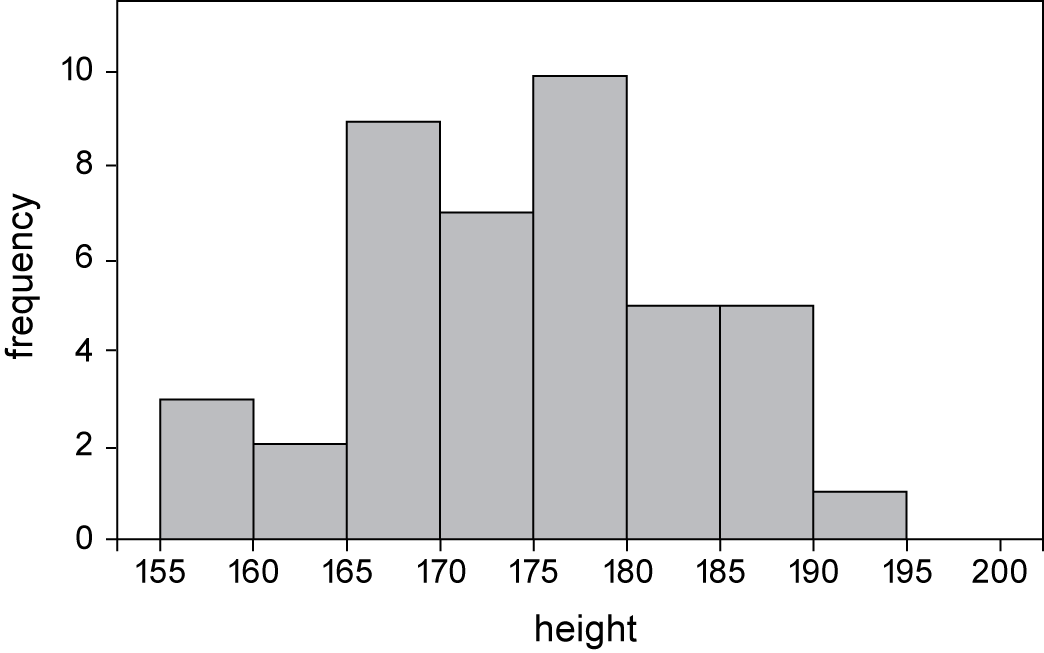
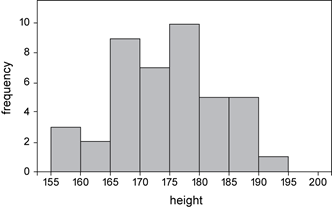
The histogram below displays the frequency distribution of the heights (in cm) of a sample of 42 people with class intervals of width 5 cm.
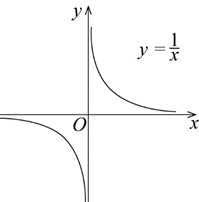
A hyperbola is the graph of a curve in two parts separated by straight lines called asymptotes. The simplest example is the graph of \(y=\frac1x,\;x\neq0\), called a rectangular hyperbola.
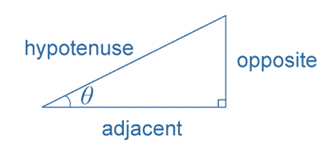
The hypotenuse is the side opposite the right angle. It is also always the longest side in a right-angled triangle.