- Home
- Resources
- Work samples
- Samples
- Data analysis: Food scarcity - ABOVE
Geography
Year 9
Above satisfactory
Data analysis: Food scarcity
Summary of task
Over a period of six weeks, students examined the biomes of the world, how humans have altered environments for food production, and the main challenges of providing food security. Various case studies were used from Australia and other parts of the world throughout the unit of study. Students were assessed under supervised conditions in class over three 40-minute lessons. They were required to interpret a range of data and information and provide short responses to a demonstrate their skills and understandings. Finally, the concept of food miles was explored to understand how local human activity influences global systems. Students were asked to create a presentation proposing local actions that could reduce the impact of food miles, and evaluated the sustainability of their strategies from economic, environmental and social perspectives.
Achievement standard
By the end of Year 9, students explain how geographical processes change the characteristics of places. They analyse interconnections between people, places and environments and explain how these interconnections influence people, and change places and environments. They predict changes in the characteristics of places over time and identify the possible implications of change for the future. Students analyse alternative strategies to a geographical challenge using environmental, social and economic criteria.
Students use initial research to identify geographically significant questions to frame an inquiry. They evaluate a range of primary and secondary sources to select and collect relevant and reliable geographical information and data. They record and represent multi-variable data in a range of appropriate digital and non-digital forms, including a range of maps that comply with cartographic conventions. They use a range of methods and digital technologies to interpret and analyse maps, data and other information to propose explanations for patterns, trends, relationships and anomalies across time and space, and to predict outcomes. Students synthesise data and information to draw reasoned conclusions. They present findings, arguments and explanations using relevant geographical terminology and digital representations in a range of appropriate communication forms. Students propose action in response to a geographical challenge, taking account of environmental, economic and social factors, and predict the outcomes and consequences of their proposal.
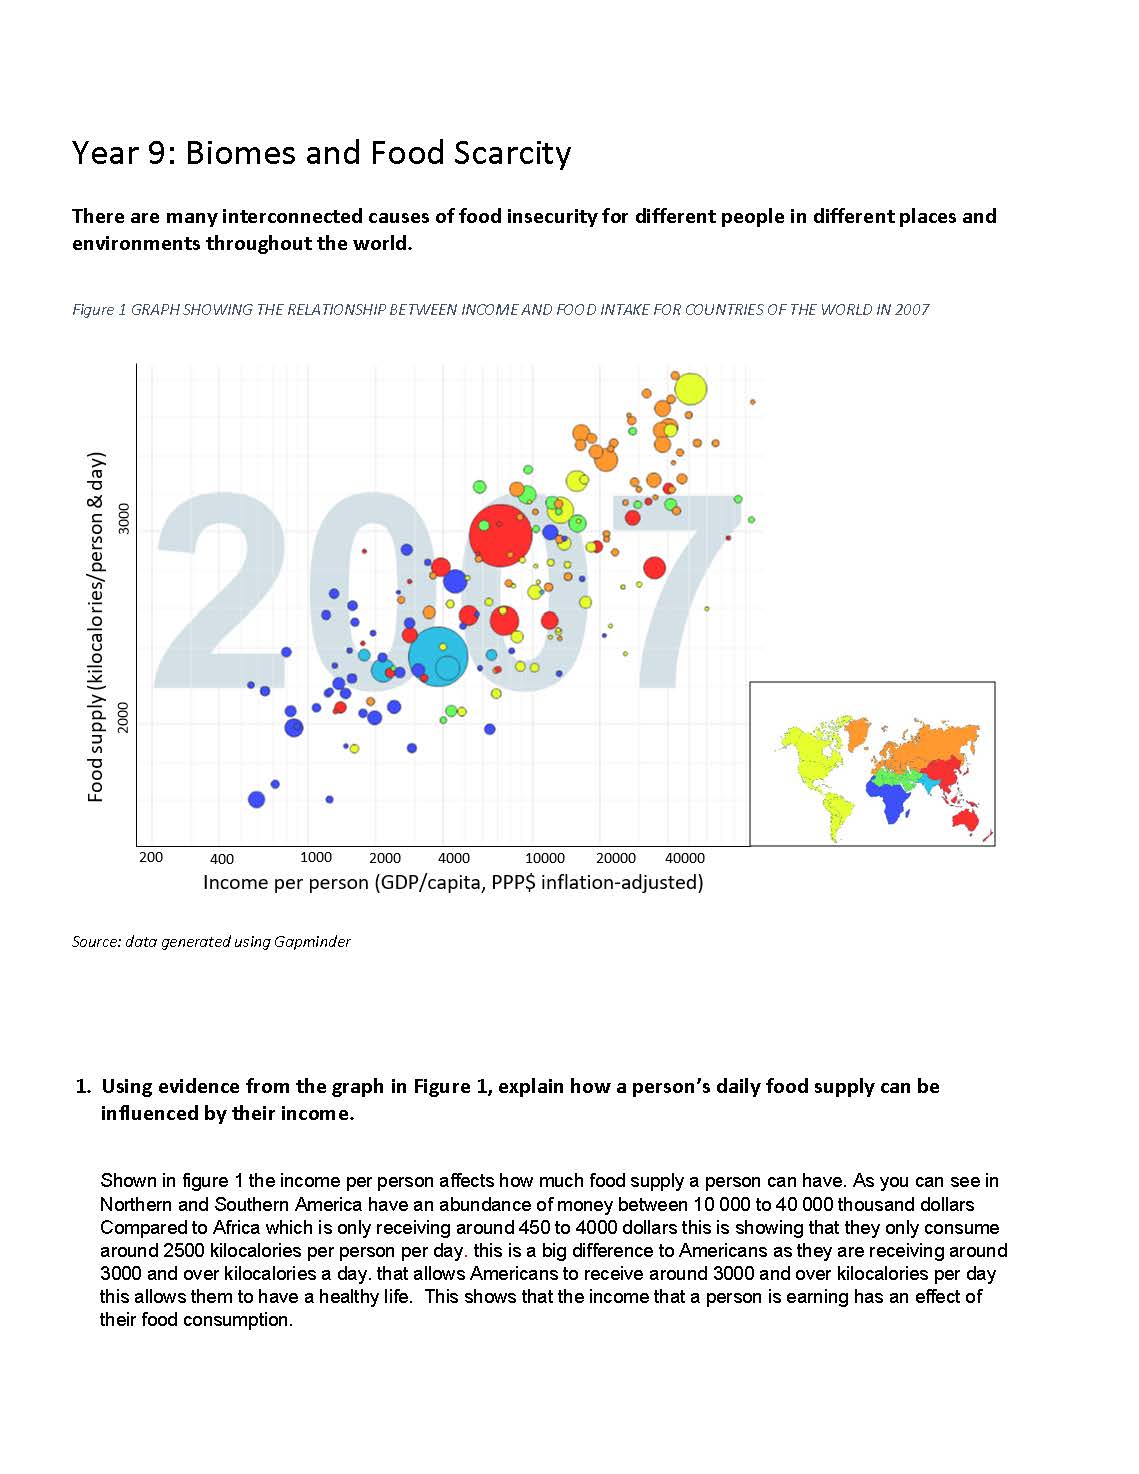 1
Annotation 1
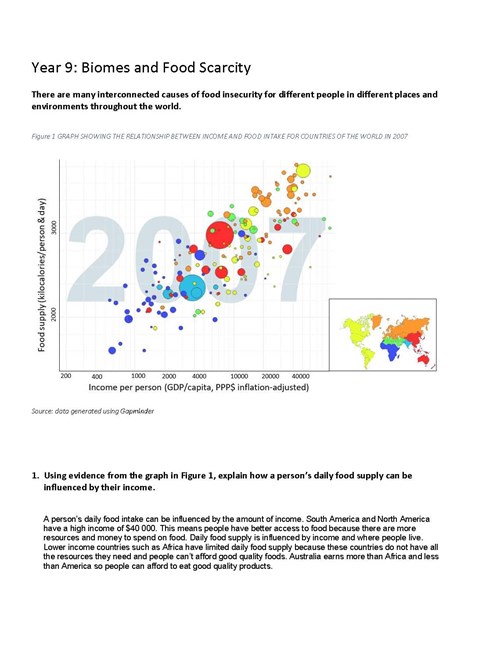
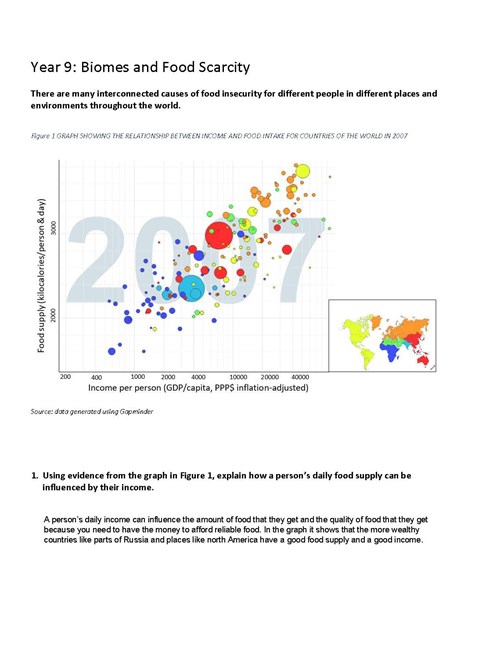
Uses detailed examples to explain how food supply is influenced by place and income 2 Annotation 2
Develops a complex synthesis of place, income and kilocalorie data from the source 3 Annotation 3
Offers a concise conclusion from synthesised data
-
Annotations
-
1
Annotation 1
Uses detailed examples to explain how food supply is influenced by place and income -
2
Annotation 2
Develops a complex synthesis of place, income and kilocalorie data from the source -
3
Annotation 3
Offers a concise conclusion from synthesised data
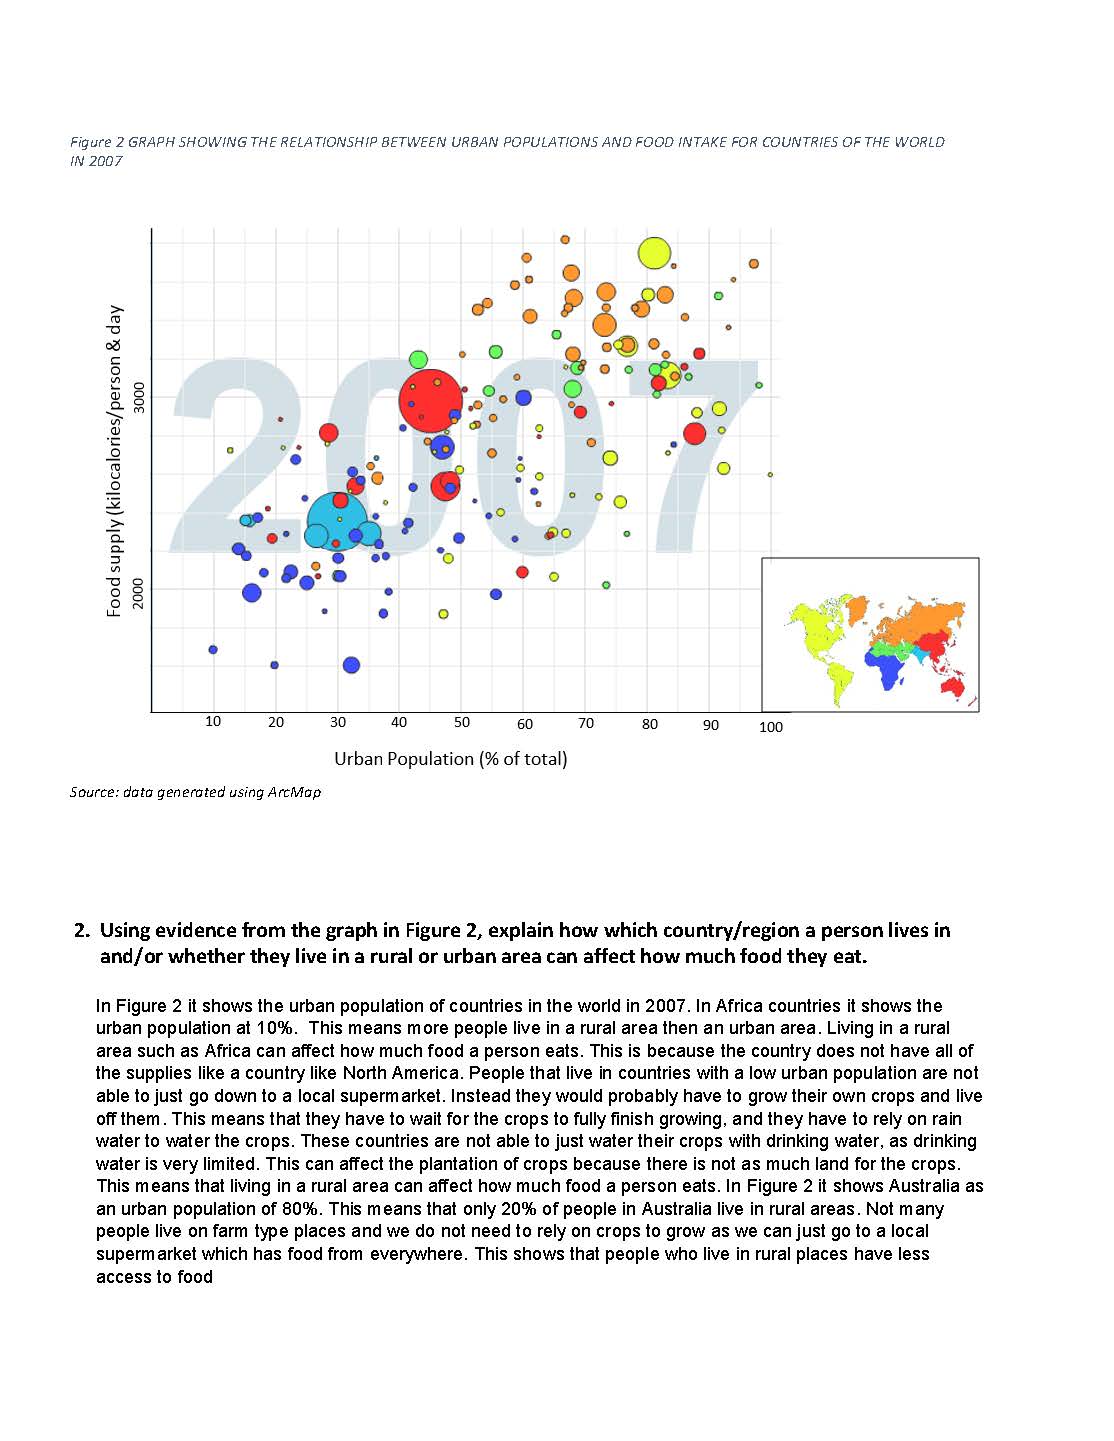 1
Annotation 1
Interprets the data source, using examples and statistics 2 Annotation 2
Explains the interconnection between food supply and rural and urban places across the world using examples and statistics 3 Annotation 3
Explains how food supply and geographic location affect people, using a range of examples and statistics 4 Annotation 4
Draws reasoned conclusion about place, food supply and consumption
-
Annotations
-
1
Annotation 1
Interprets the data source, using examples and statistics -
2
Annotation 2
Explains the interconnection between food supply and rural and urban places across the world using examples and statistics -
3
Annotation 3
Explains how food supply and geographic location affect people, using a range of examples and statistics -
4
Annotation 4
Draws reasoned conclusion about place, food supply and consumption
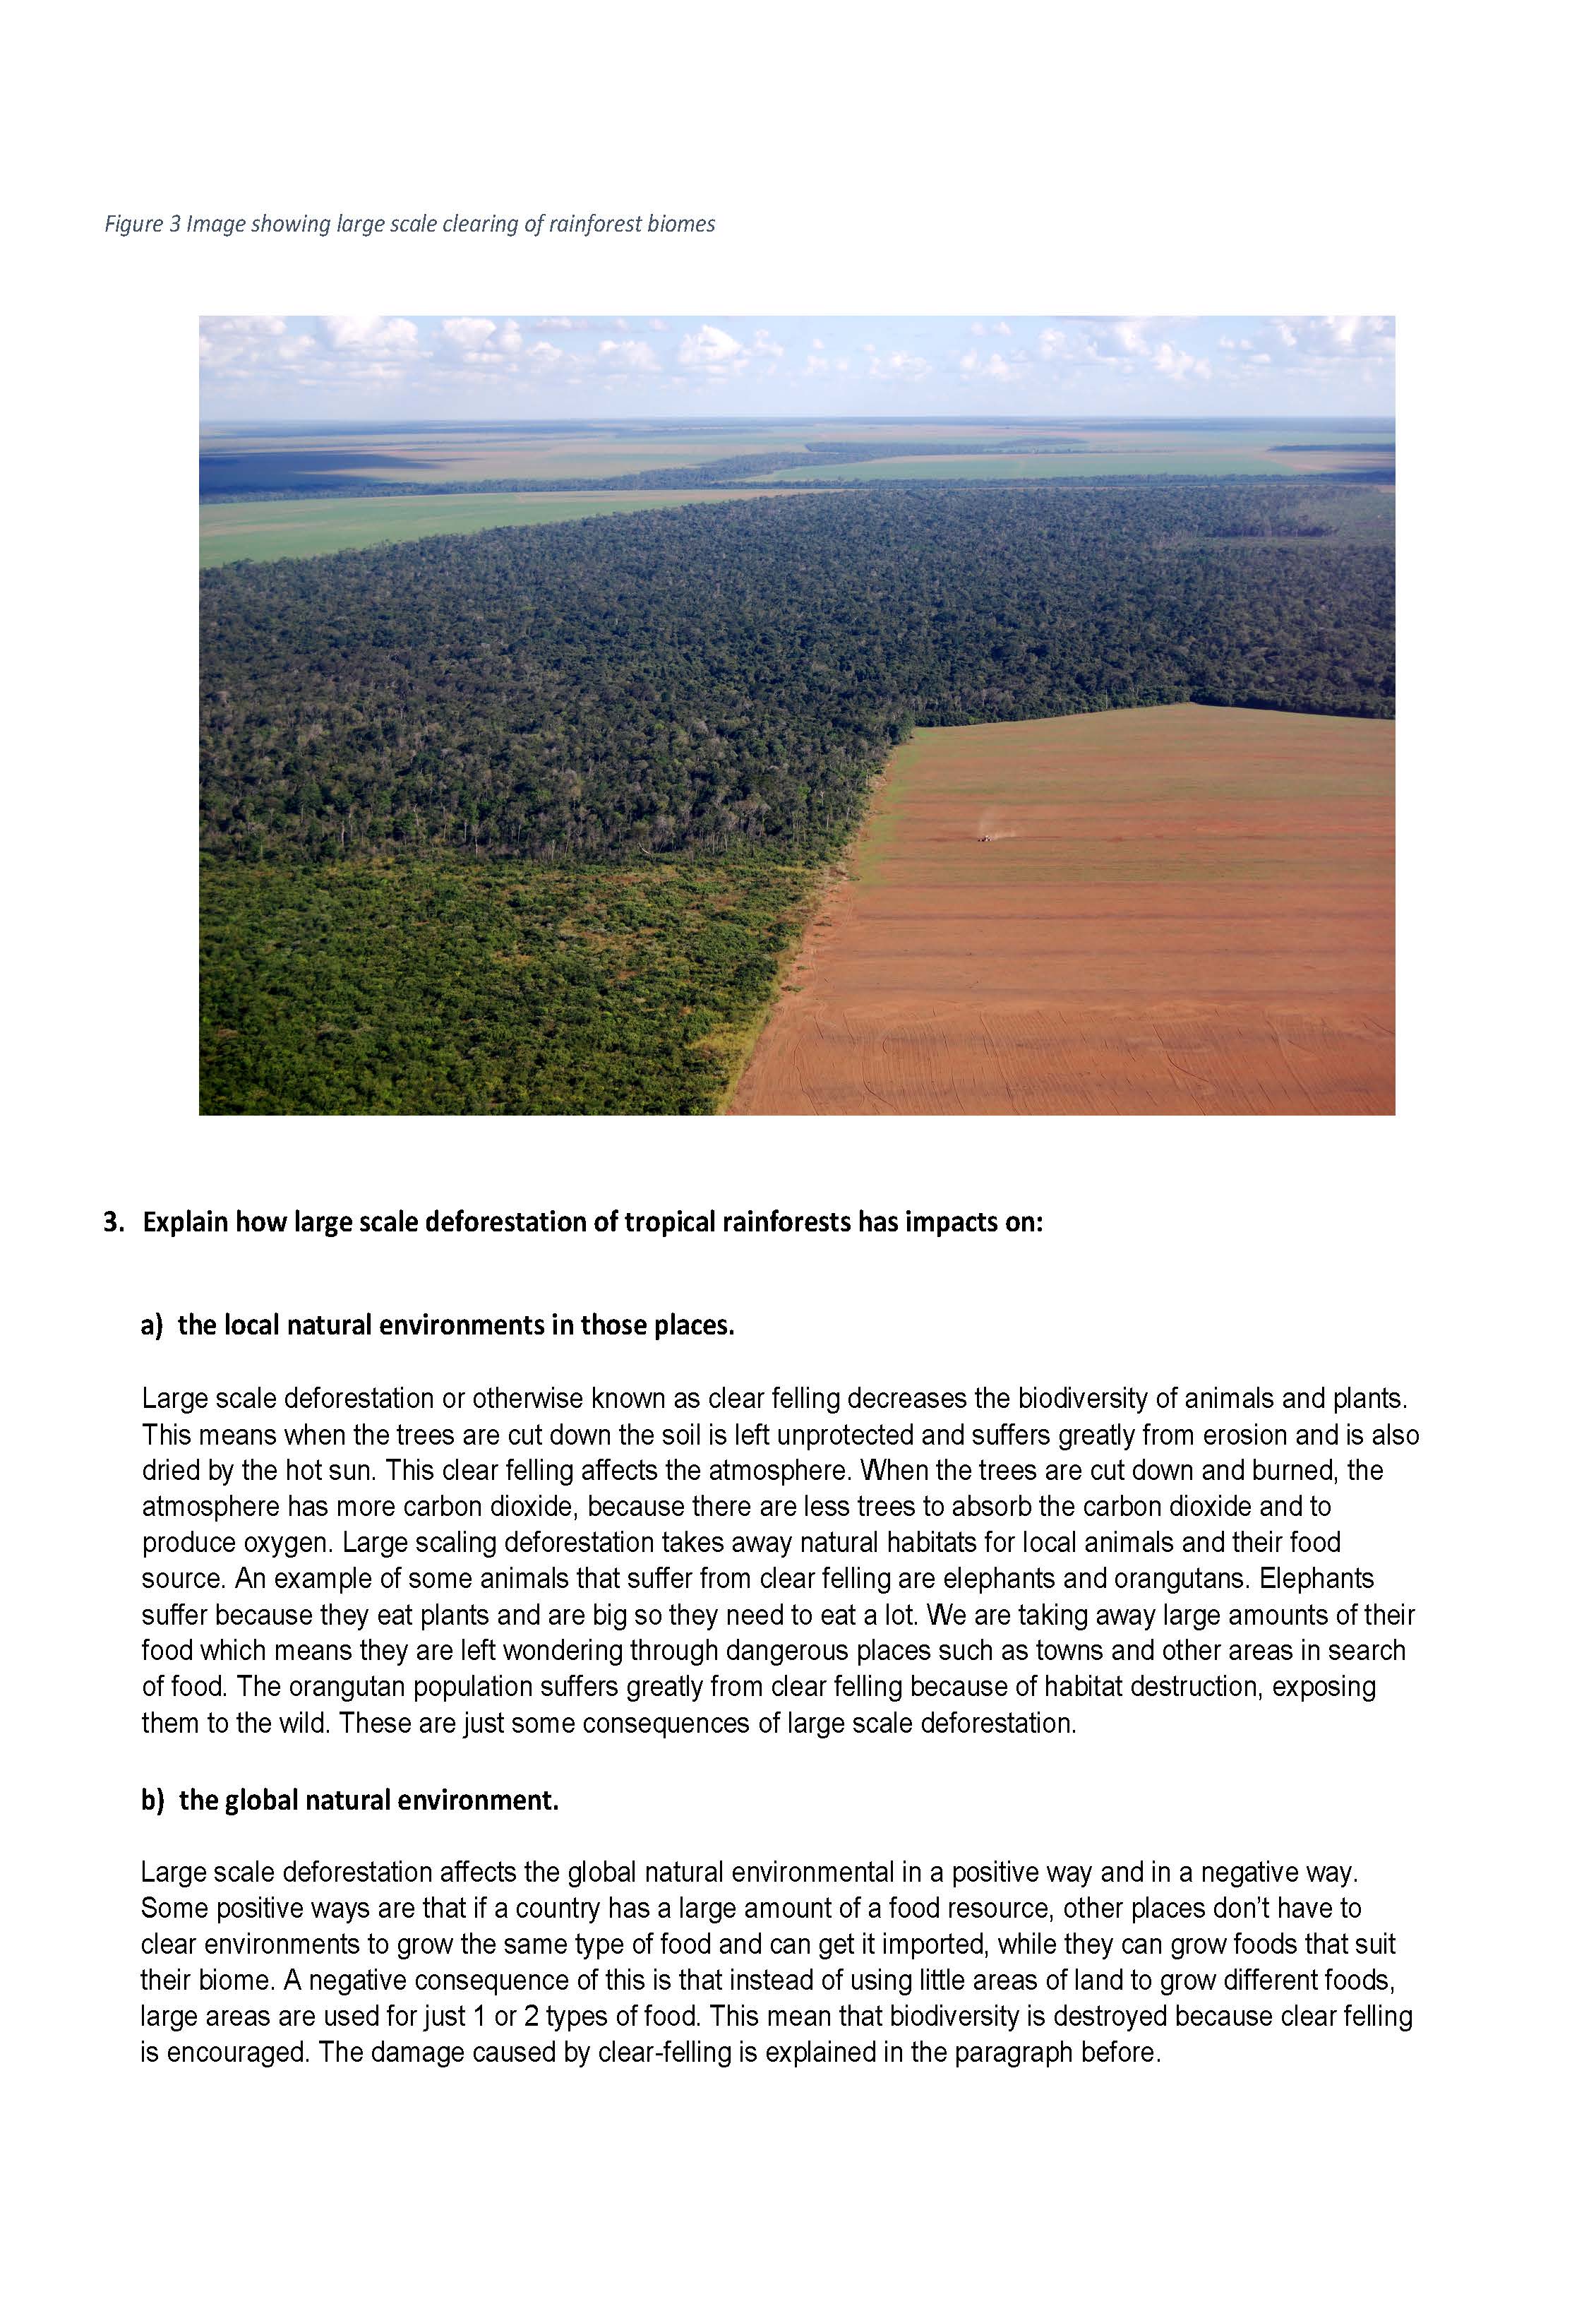 1
Annotation 1
Uses a range of relevant specific geographical terminology throughout the explanation 2 Annotation 2
Develops a coherent, accurate explanation, with examples, about a range of natural processes and how they are affected by deforestation 3 Annotation 3
Uses specific examples to give a coherent and accurate explanation about how the deforestation causes global change 4 Annotation 4
Uses relevant geographical terminology 5 Annotation 5
Explains the interconnection between local and global natural environments 6 Annotation 6
Draws a reasoned conclusion about the positive and negative effects of deforestation on global natural environments
-
Annotations
-
1
Annotation 1
Uses a range of relevant specific geographical terminology throughout the explanation -
2
Annotation 2
Develops a coherent, accurate explanation, with examples, about a range of natural processes and how they are affected by deforestation -
3
Annotation 3
Uses specific examples to give a coherent and accurate explanation about how the deforestation causes global change -
4
Annotation 4
Uses relevant geographical terminology -
5
Annotation 5
Explains the interconnection between local and global natural environments -
6
Annotation 6
Draws a reasoned conclusion about the positive and negative effects of deforestation on global natural environments
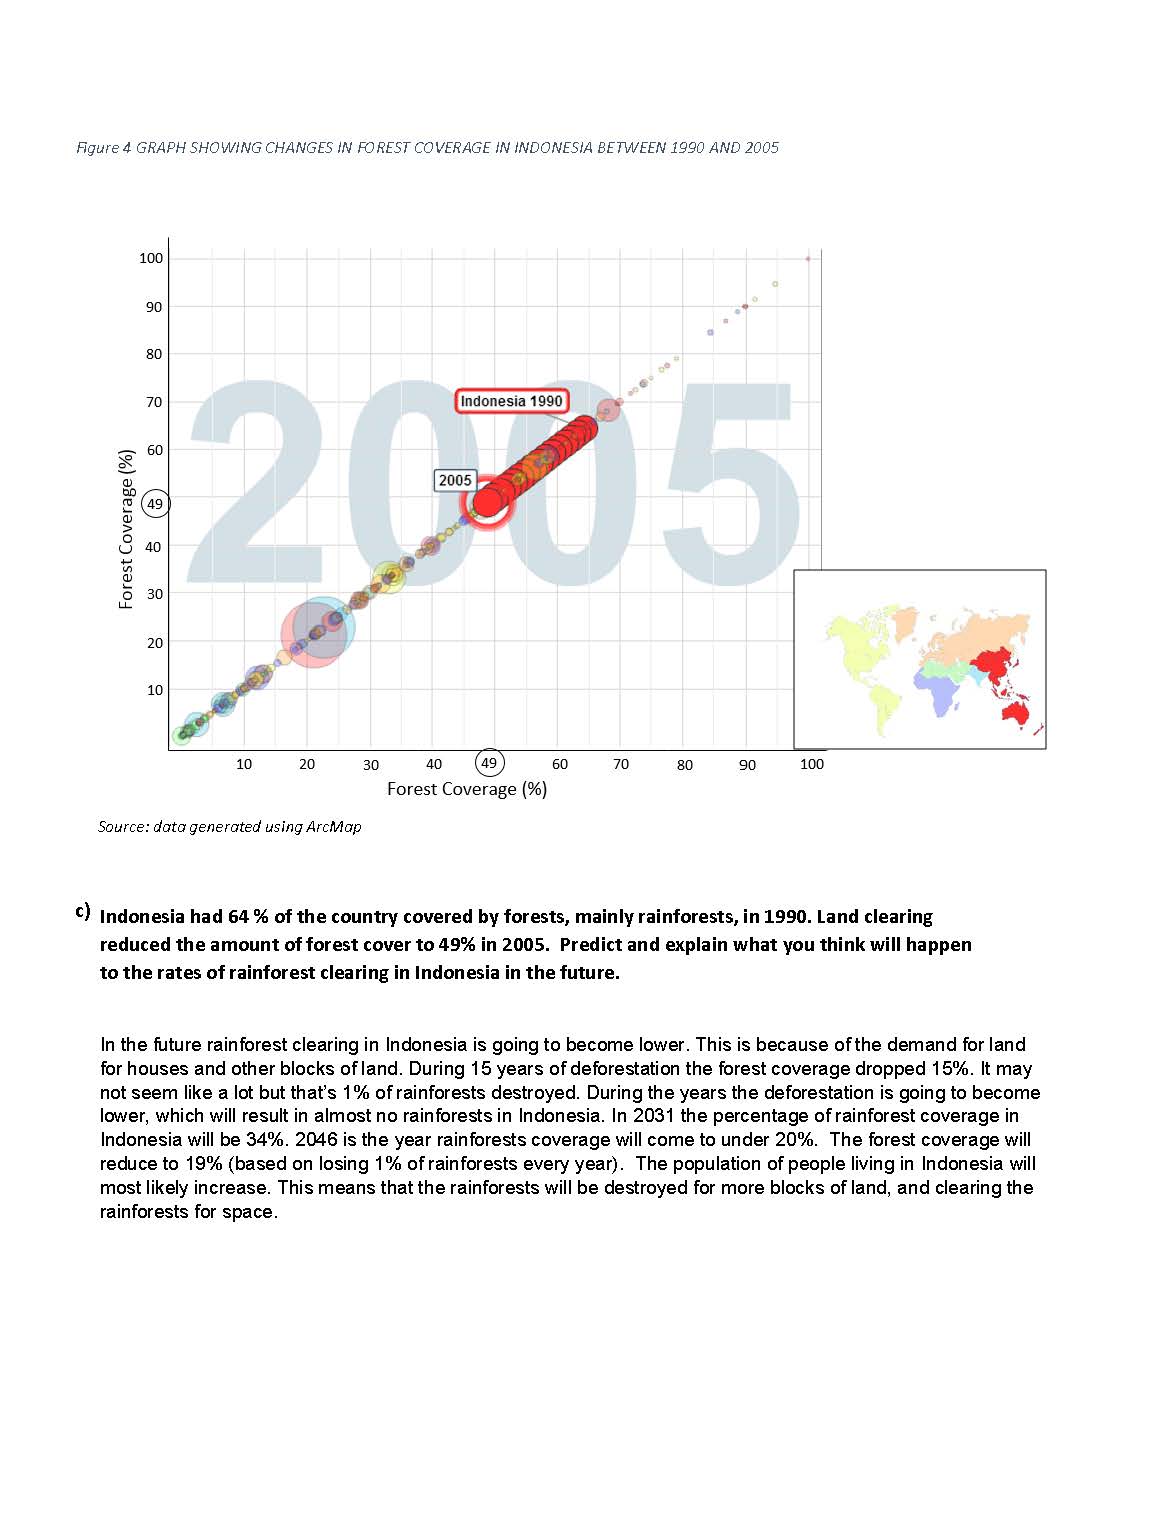 1
Annotation 1
Interprets graphical data 2 Annotation 2
Uses relevant specific geographical terminology throughout the explanation 3 Annotation 3
Provides a coherent prediction, using conceptual arguments, about a geographical outcome 4 Annotation 4
Synthesises specific data and information about forest coverage, time and place to inform a prediction
-
Annotations
-
1
Annotation 1
Interprets graphical data -
2
Annotation 2
Uses relevant specific geographical terminology throughout the explanation -
3
Annotation 3
Provides a coherent prediction, using conceptual arguments, about a geographical outcome -
4
Annotation 4
Synthesises specific data and information about forest coverage, time and place to inform a prediction
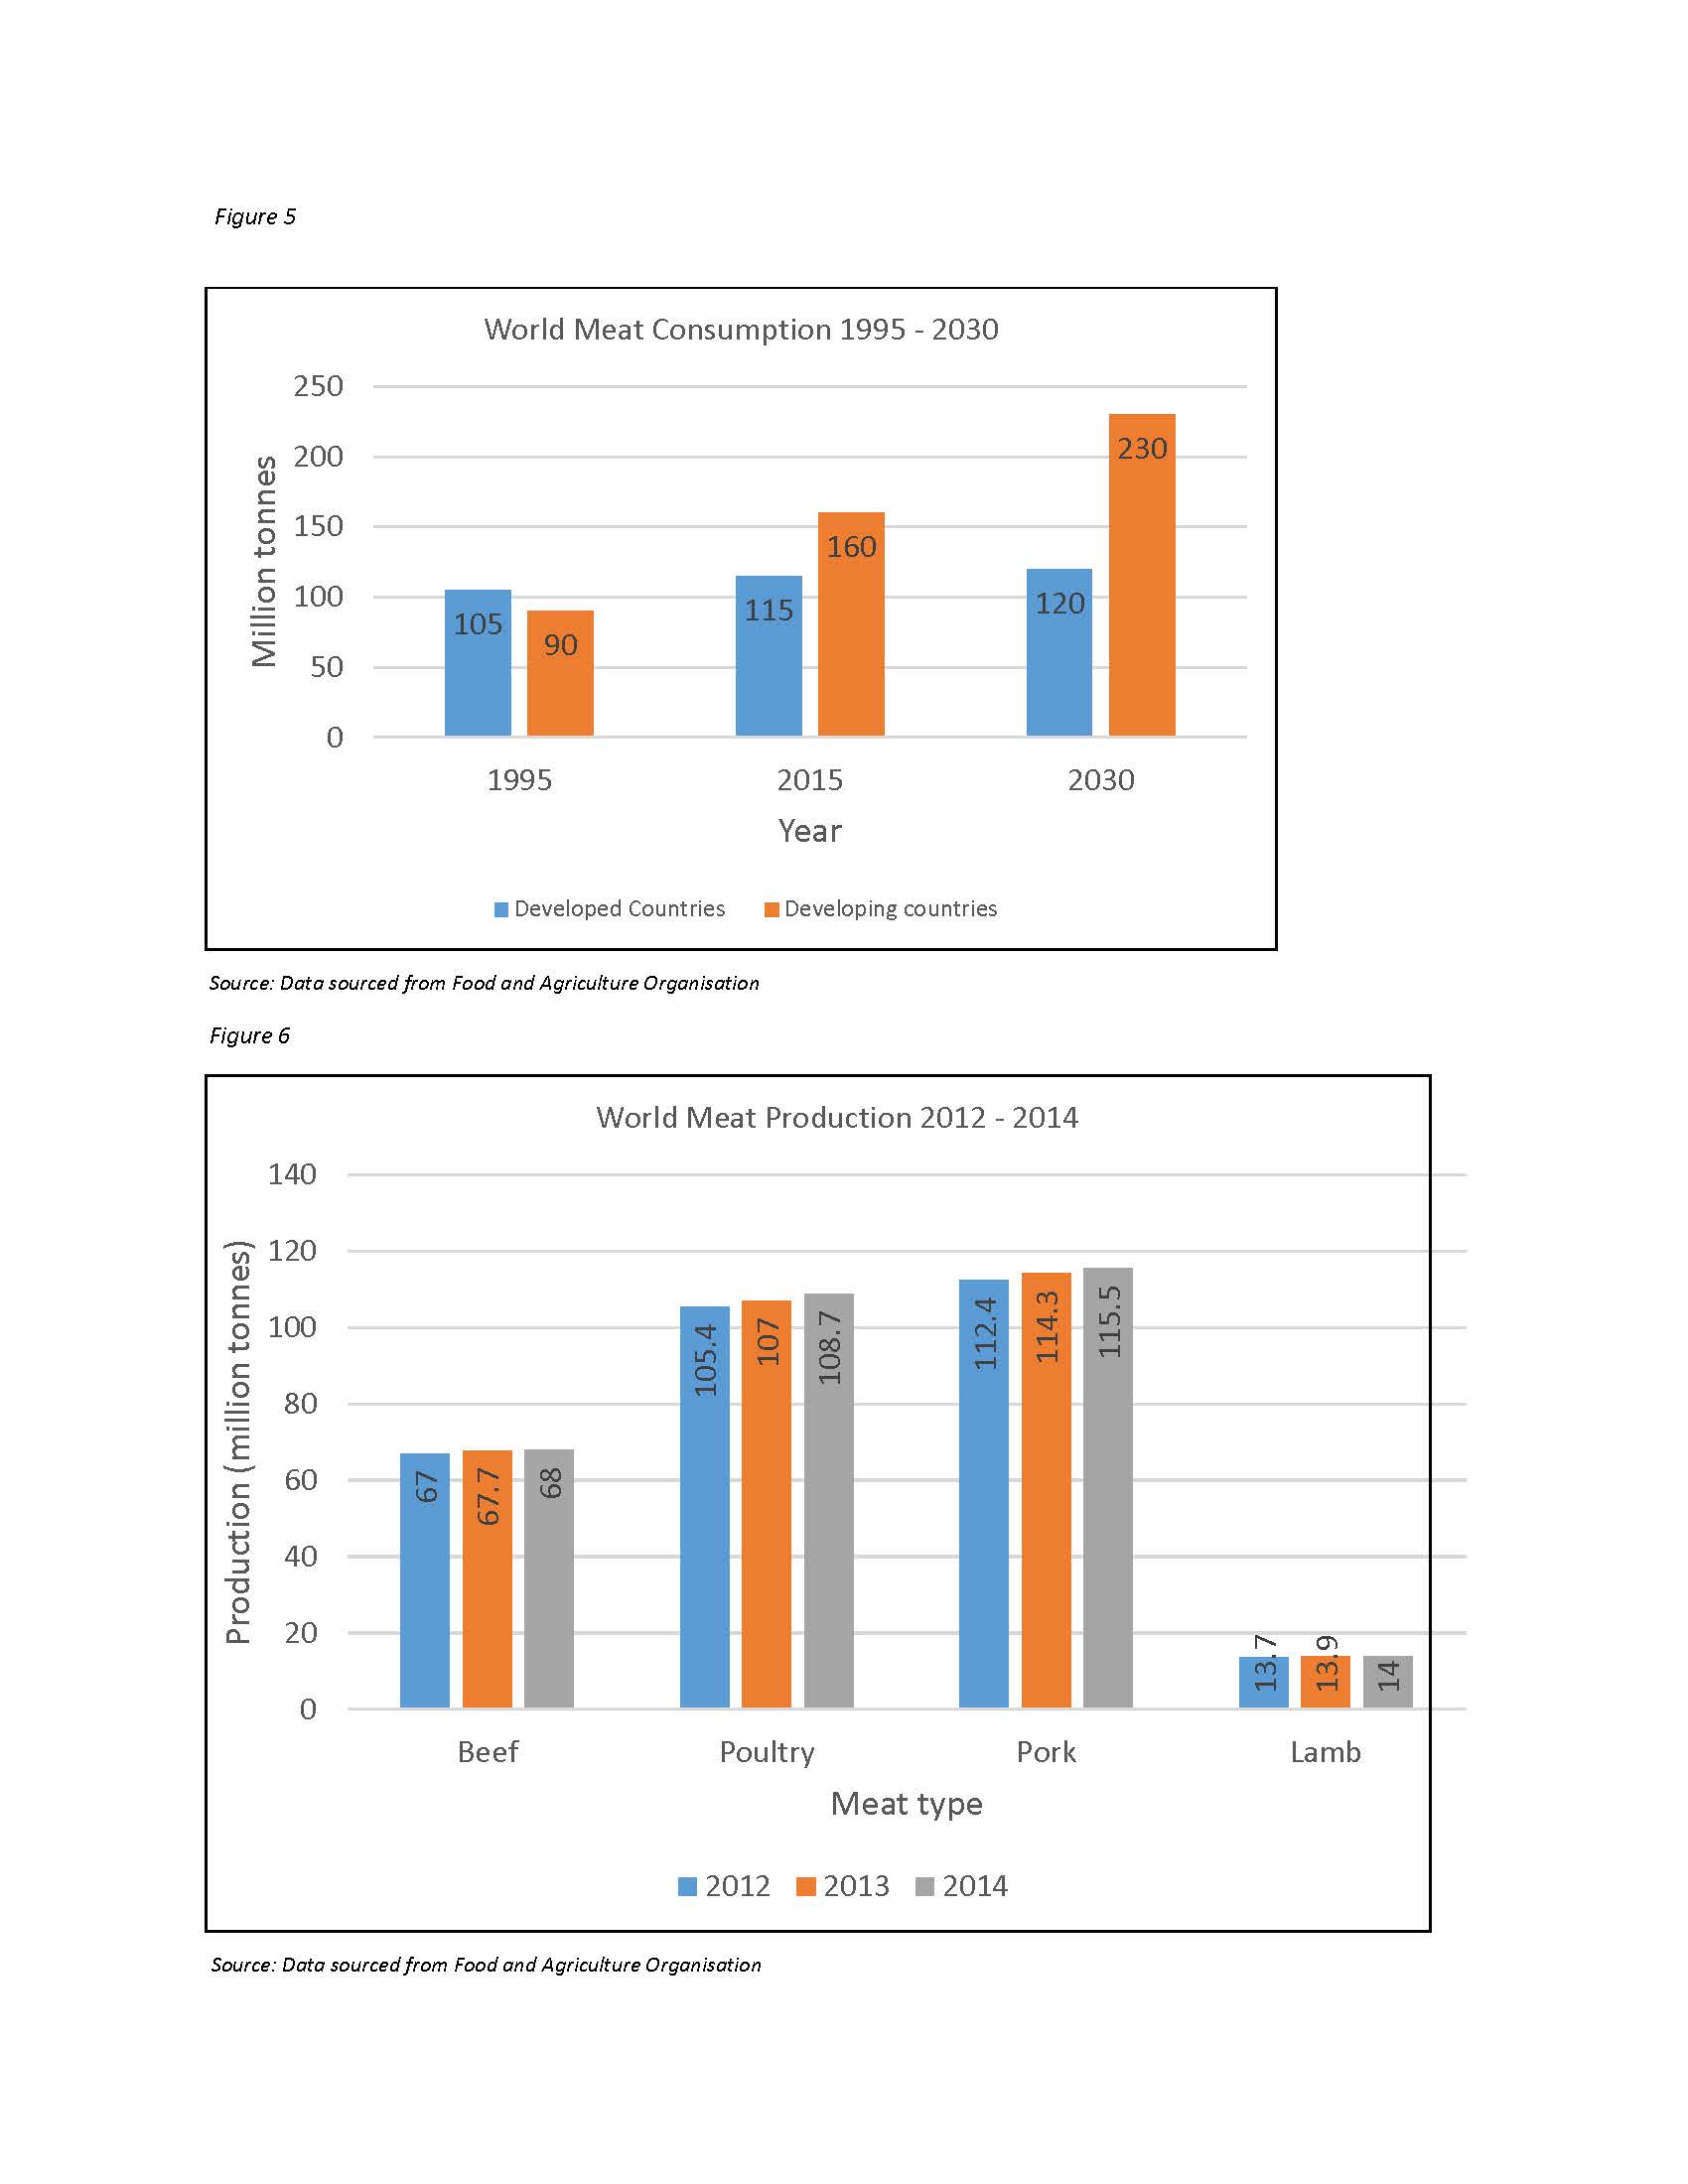
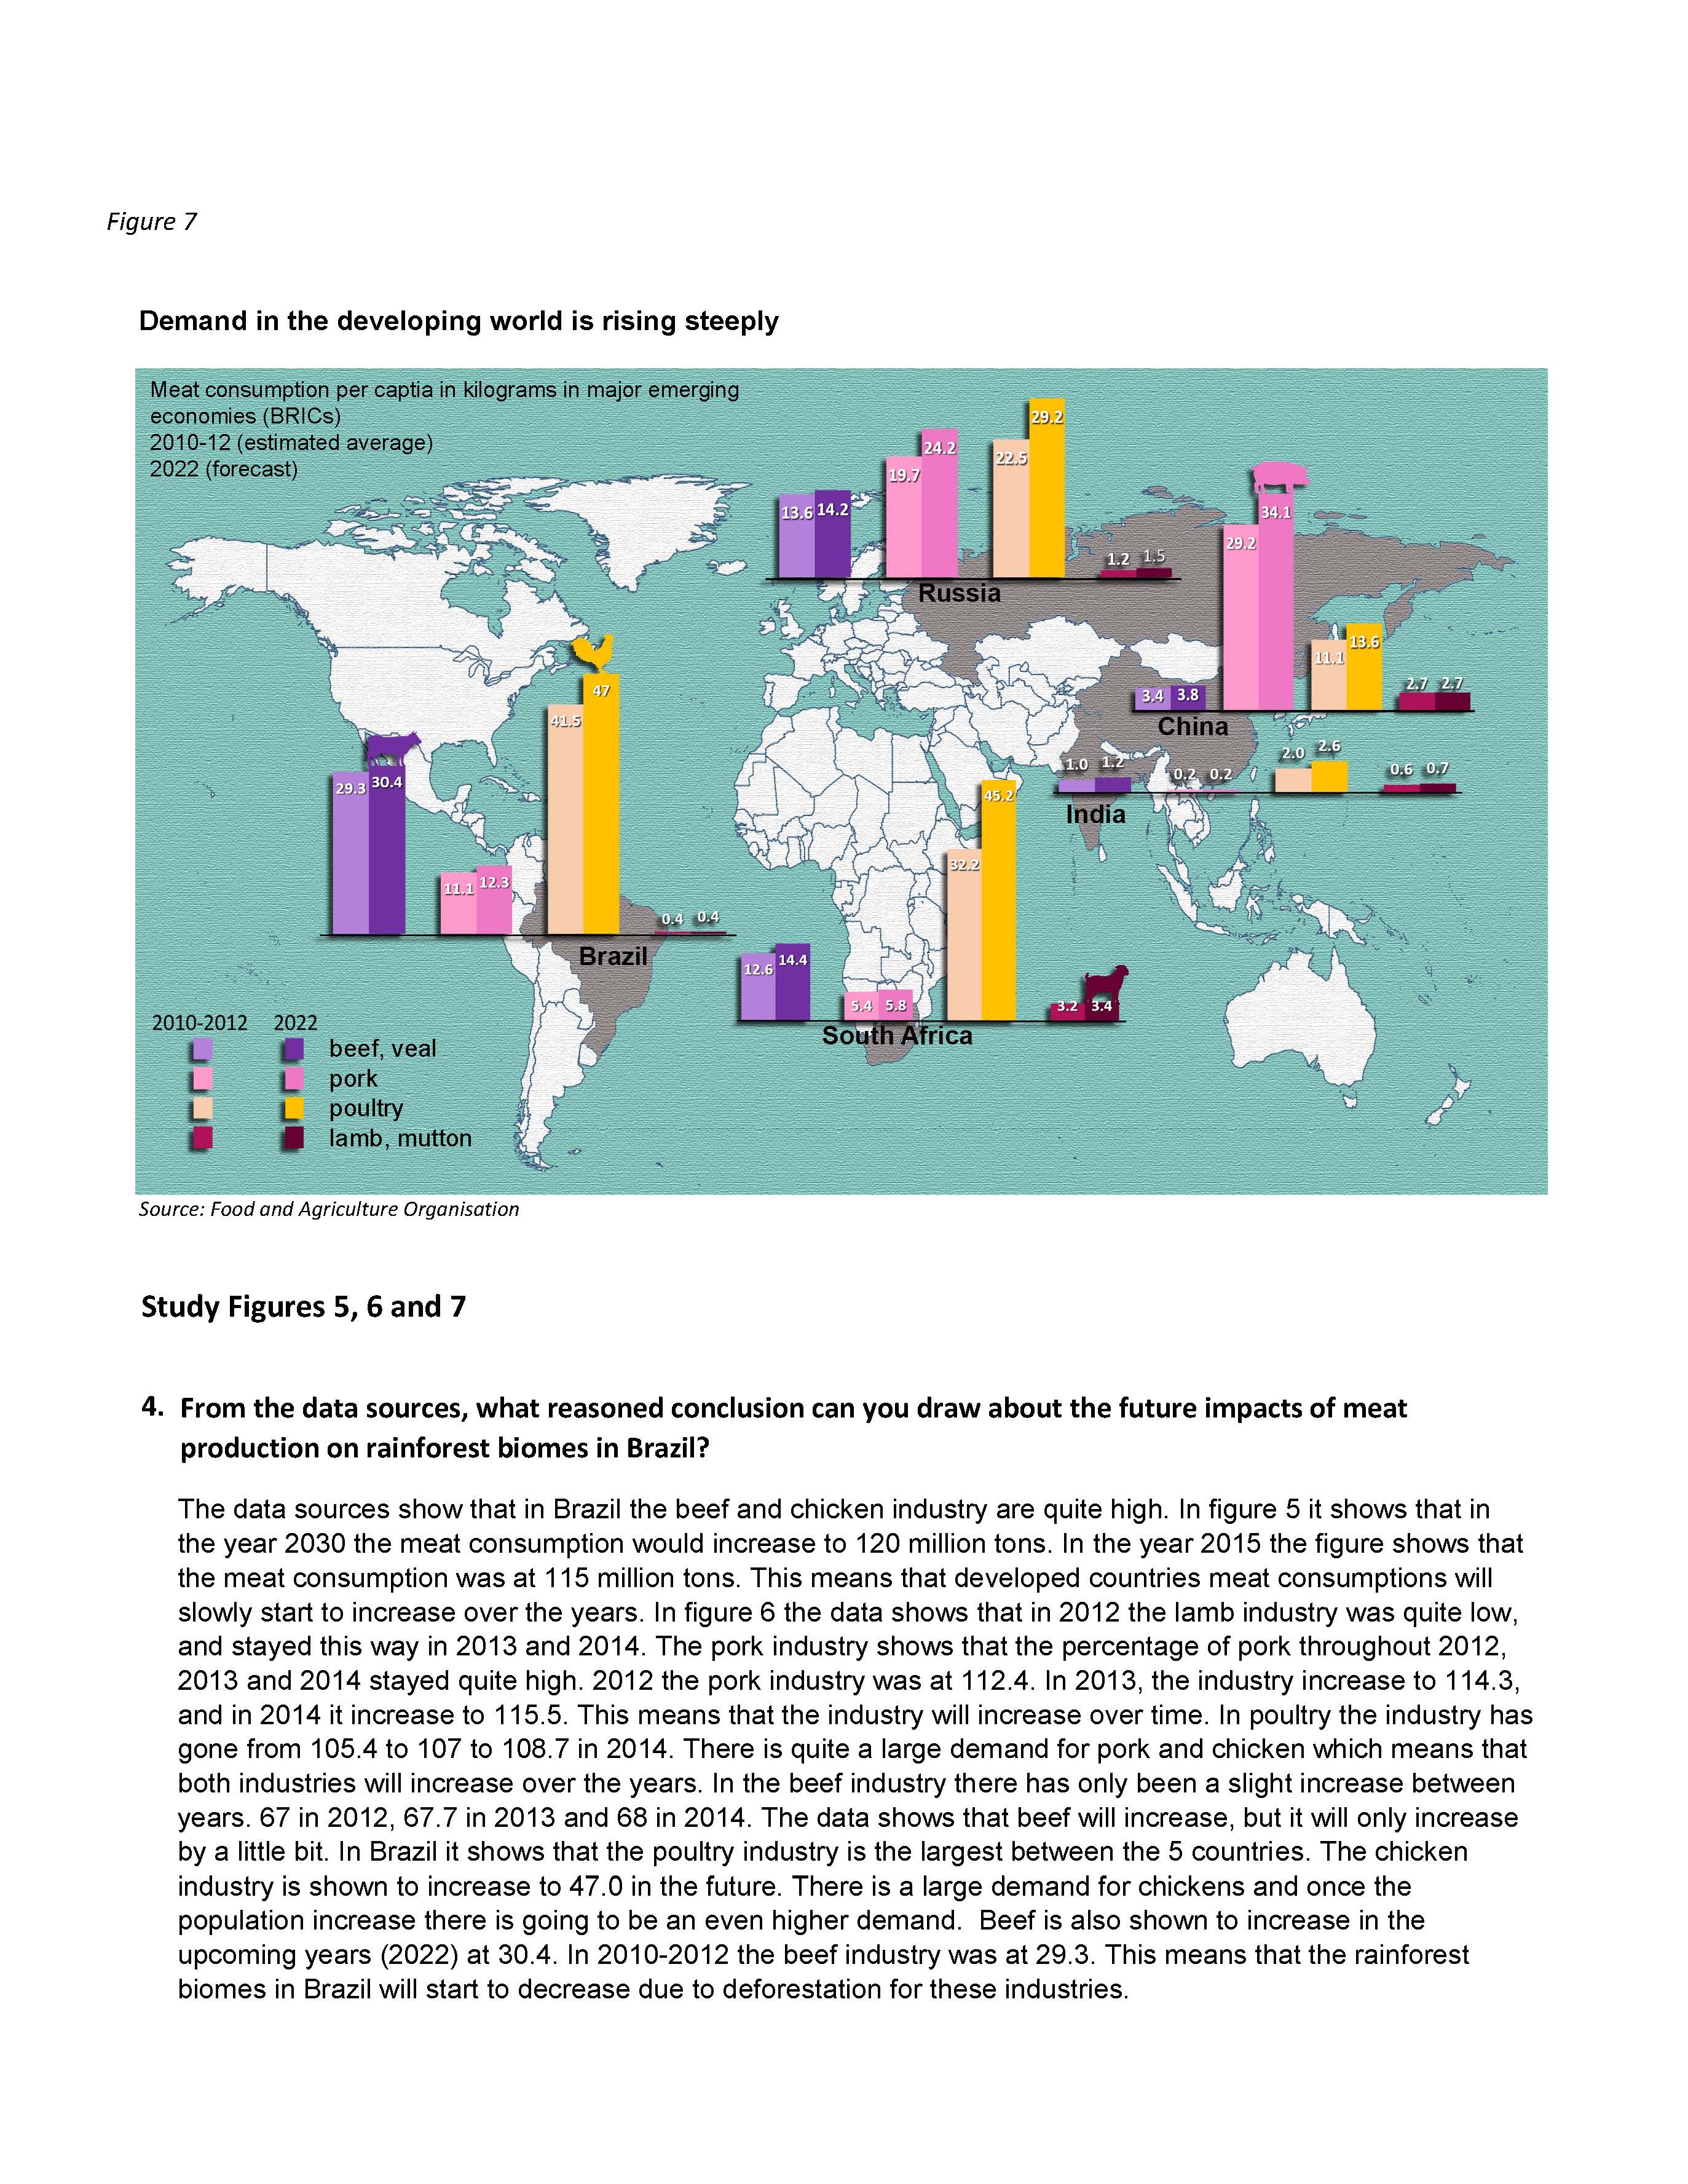 1
Annotation 1
Uses data in a clear, detailed and specific way to draw a reasoned conclusion 2 Annotation 2
Describes future impacts in biomes using examples 3 Annotation 3
Justifies reasoned conclusion using variables of time, quantity and place across a range of contexts
-
Annotations
-
1
Annotation 1
Uses data in a clear, detailed and specific way to draw a reasoned conclusion -
2
Annotation 2
Describes future impacts in biomes using examples -
3
Annotation 3
Justifies reasoned conclusion using variables of time, quantity and place across a range of contexts
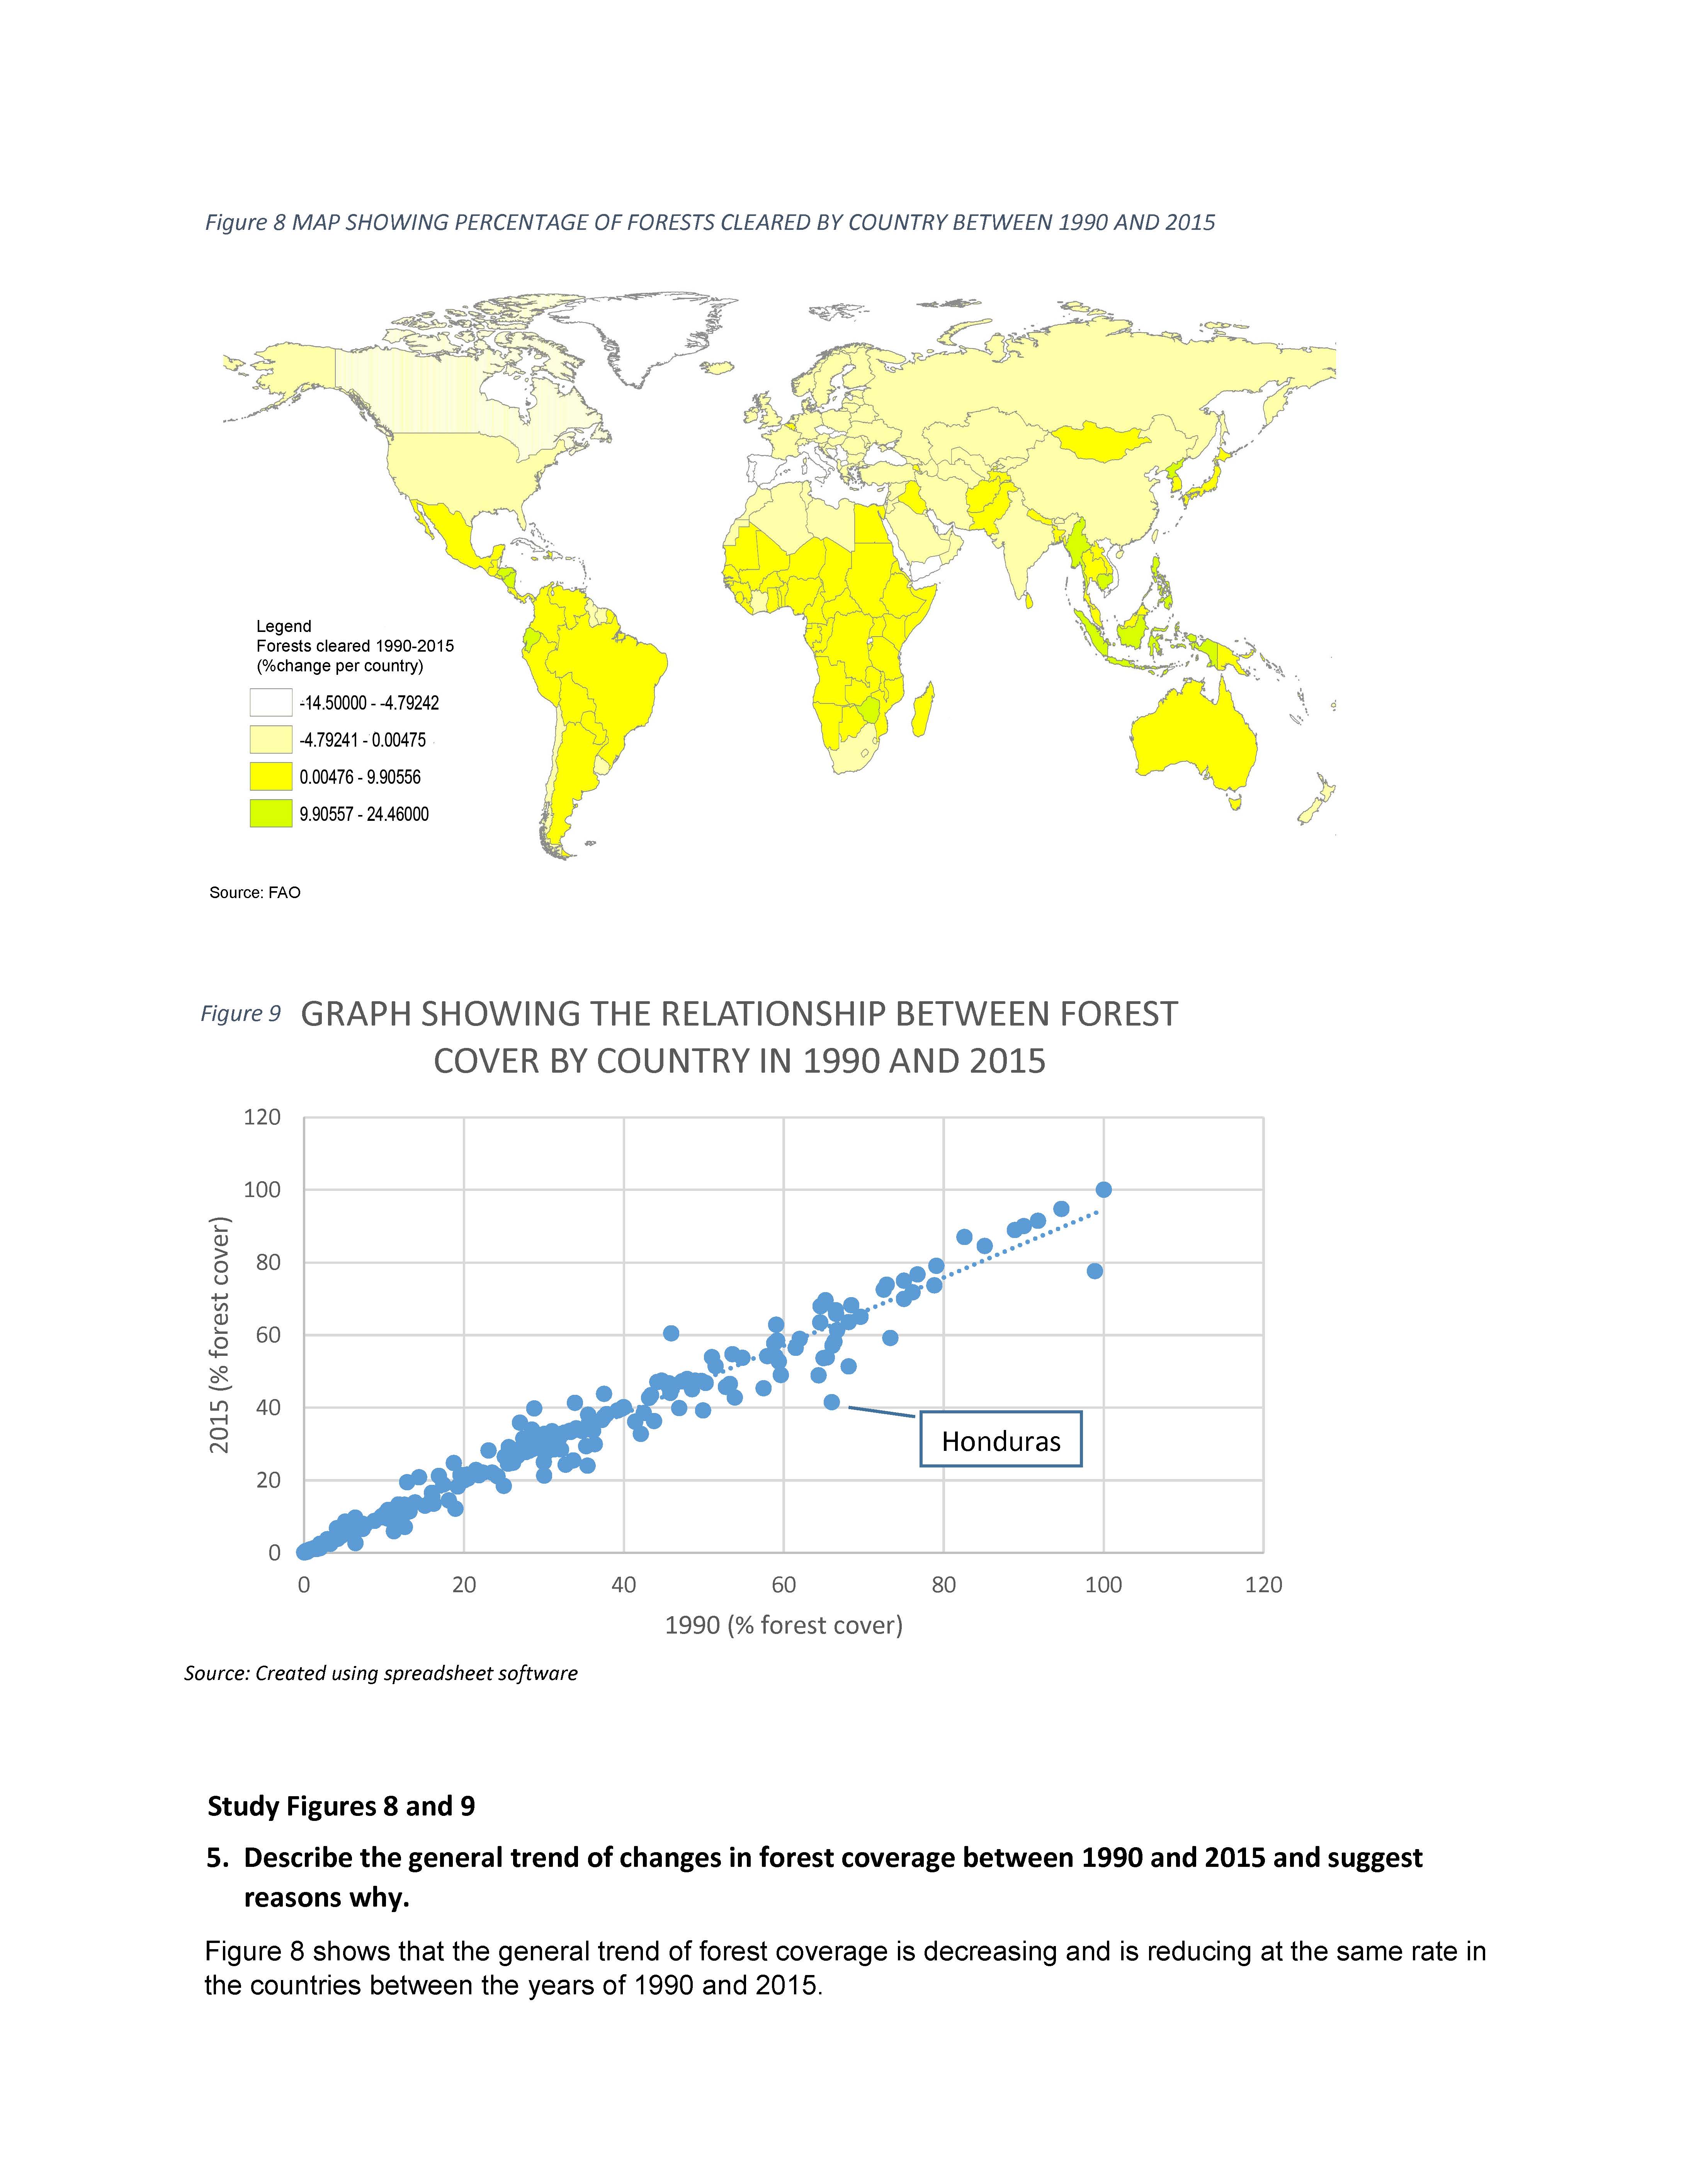
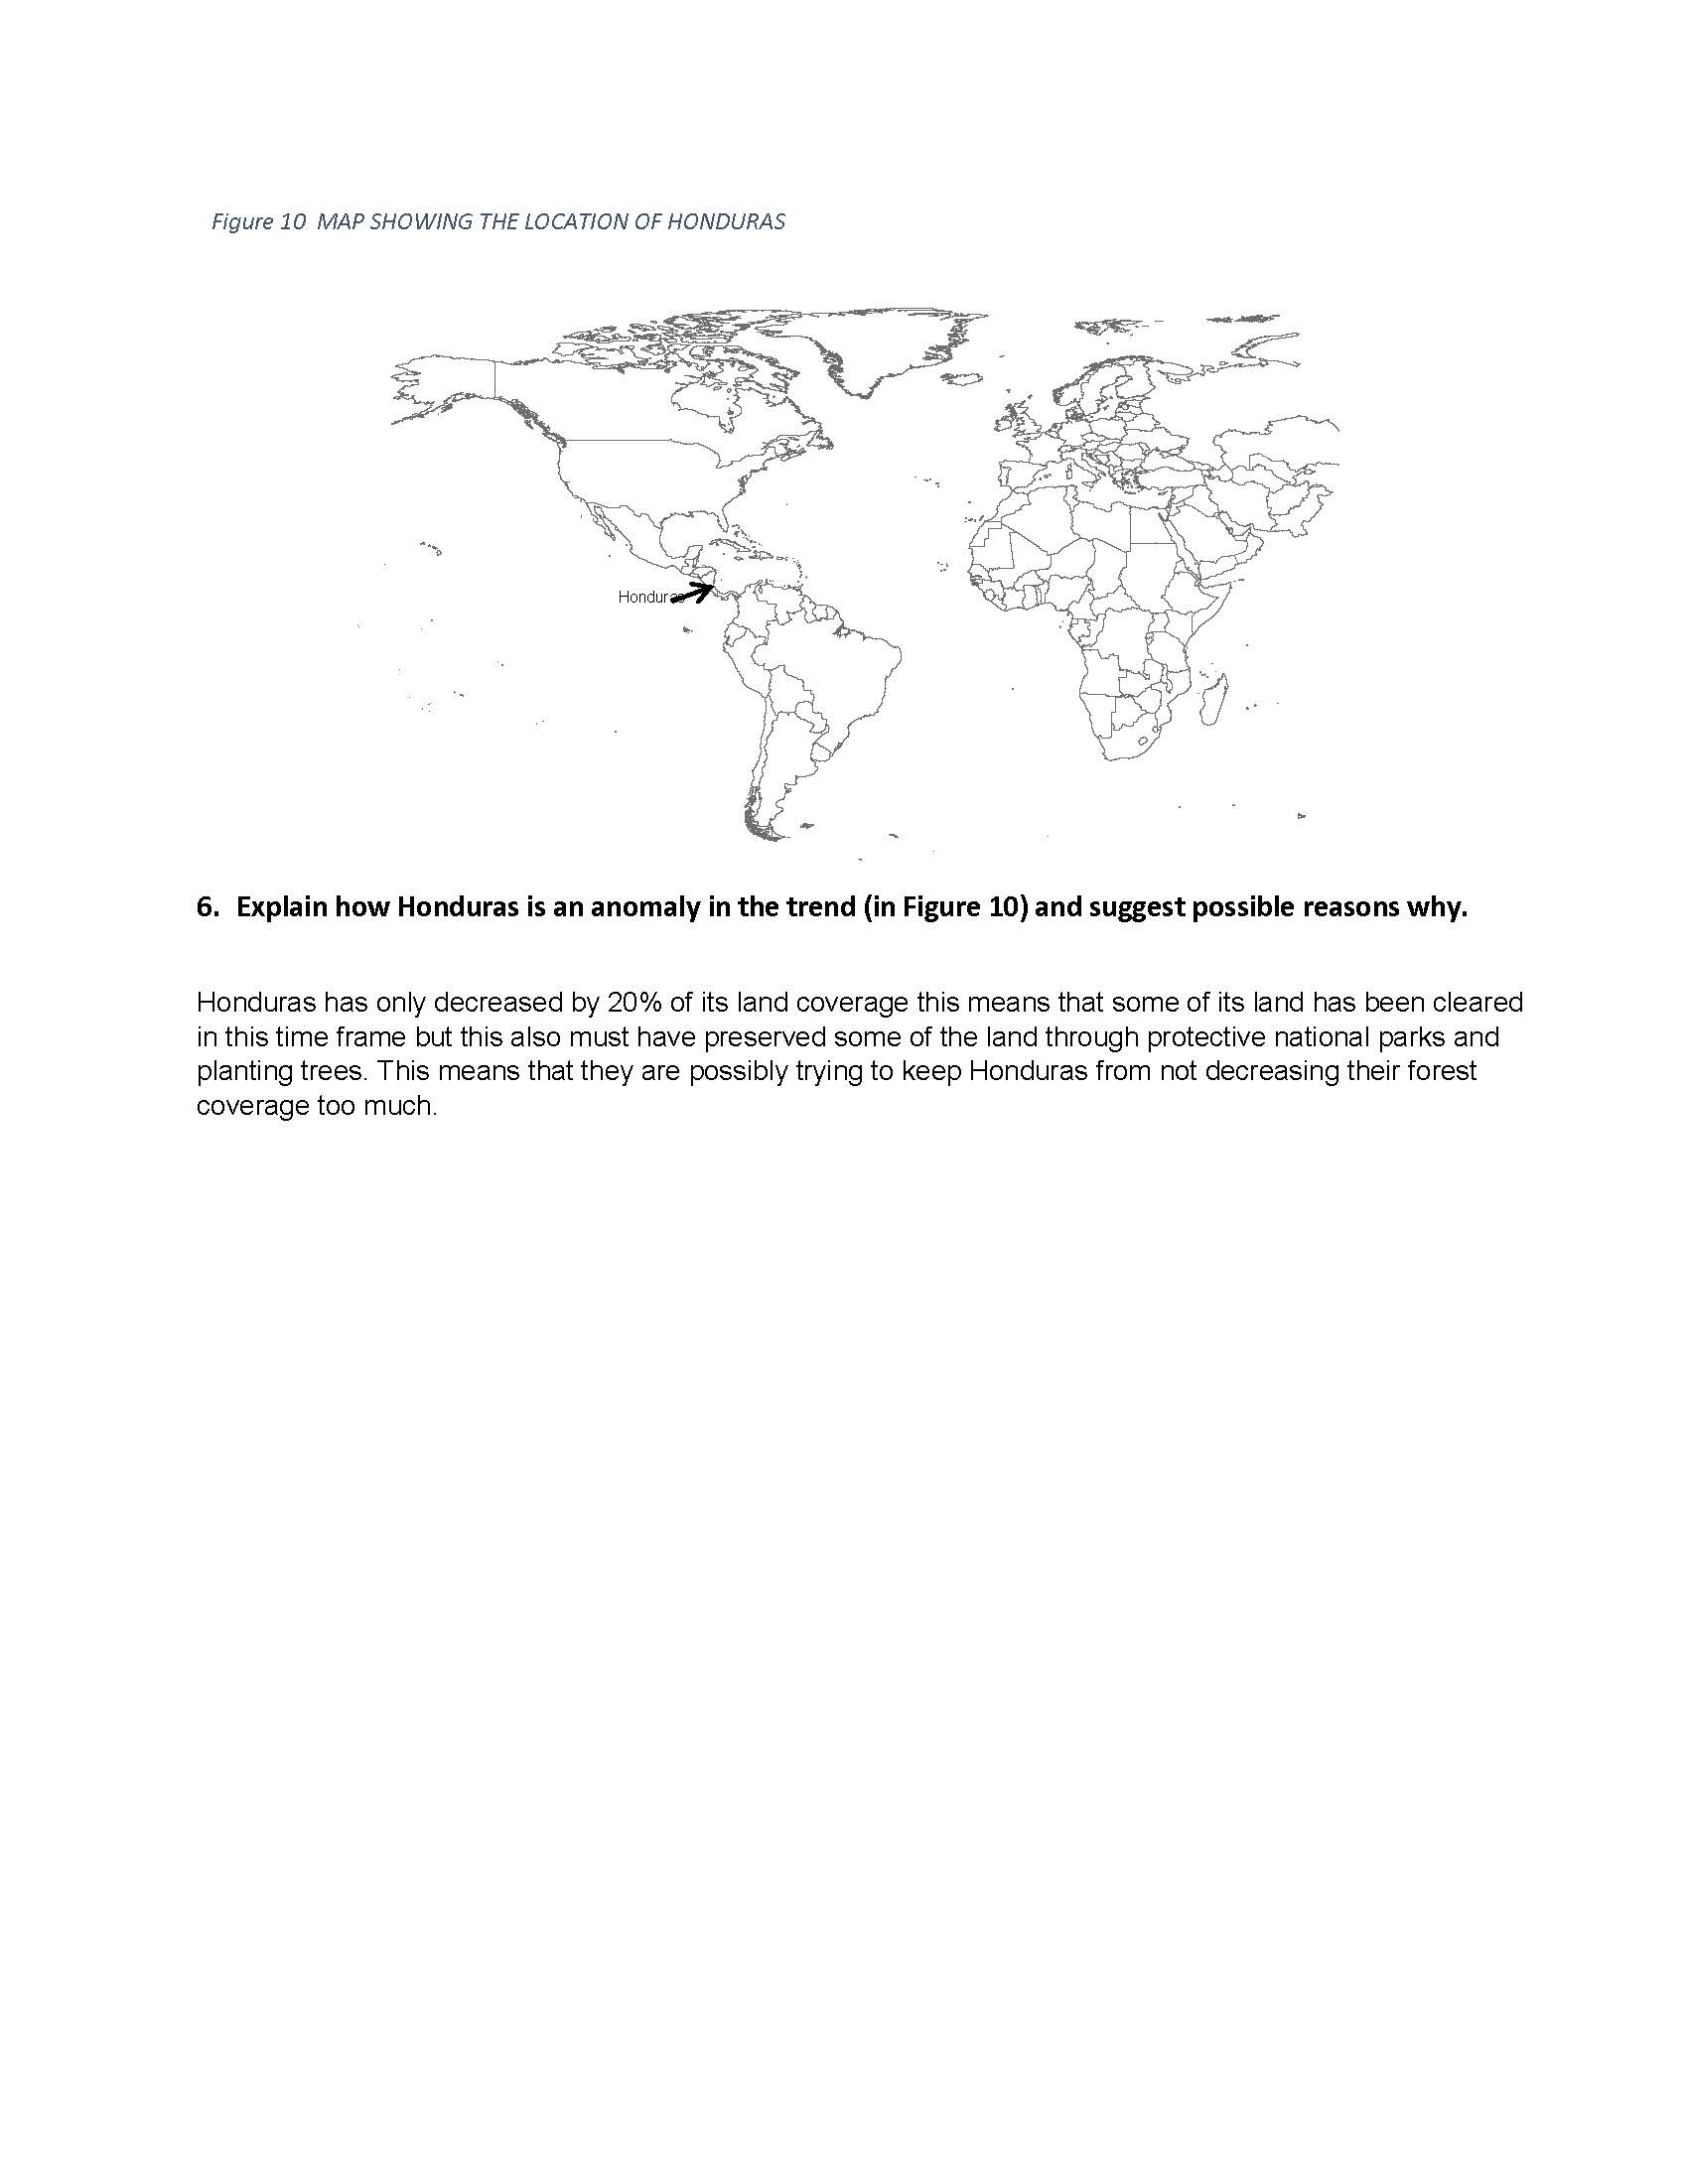 1
Annotation 1
Describes the anomaly in a graph, citing data 2 Annotation 2
Proposes several appropriate reasons for the trend using information from an inquiry
-
Annotations
-
1
Annotation 1
Describes the anomaly in a graph, citing data -
2
Annotation 2
Proposes several appropriate reasons for the trend using information from an inquiry
