- Home
- Resources
- Work samples
- Samples
- Data analysis: Water in the world – ABOVE
Geography
Year 7
Above satisfactory
Data analysis: Water in the world
Summary of task
Over a period of six weeks, students explored how water connects places, environments and people. Students used digital technologies to present the process of orographic rainfall and explain how it influences the characteristics on either side of a mountain.
Students were provided with images, graphs and thematic world maps showing average annual precipitation and access to improved drinking water. They were asked to identify global patterns of average precipitation and access to improved drinking water; describe the relationships between these patterns; and provide reasons for the identified relationships. They evaluated the usefulness of maps to understand the limitation of information, and concluded their studies by evaluating the sustainability of alternative strategies for water management.
Achievement standard
By the end of Year 7, students describe geographical processes that influence the characteristics of places and how the characteristics of places are perceived and valued differently. They explain interconnections between people and places and environments and describe how these interconnections change places and environments. They describe alternative strategies to a geographical challenge referring to environmental, economic and social factors.
Students identify geographically significant questions to frame an inquiry. They evaluate a range of primary and secondary sources to locate useful information and data. They record and represent data and the location and distribution of geographical phenomena in a range of forms, including large-scale and small-scale maps that conform to cartographic conventions. They interpret and analyse geographical maps, data and other information to propose simple explanations for spatial distributions, patterns, trends and relationships, and draw conclusions. Students present findings and arguments using relevant geographical terminology and digital technologies in a range of communication forms. They propose action in response to a geographical challenge, taking account of environmental, economic and social factors, and describe the expected effects of their proposal.
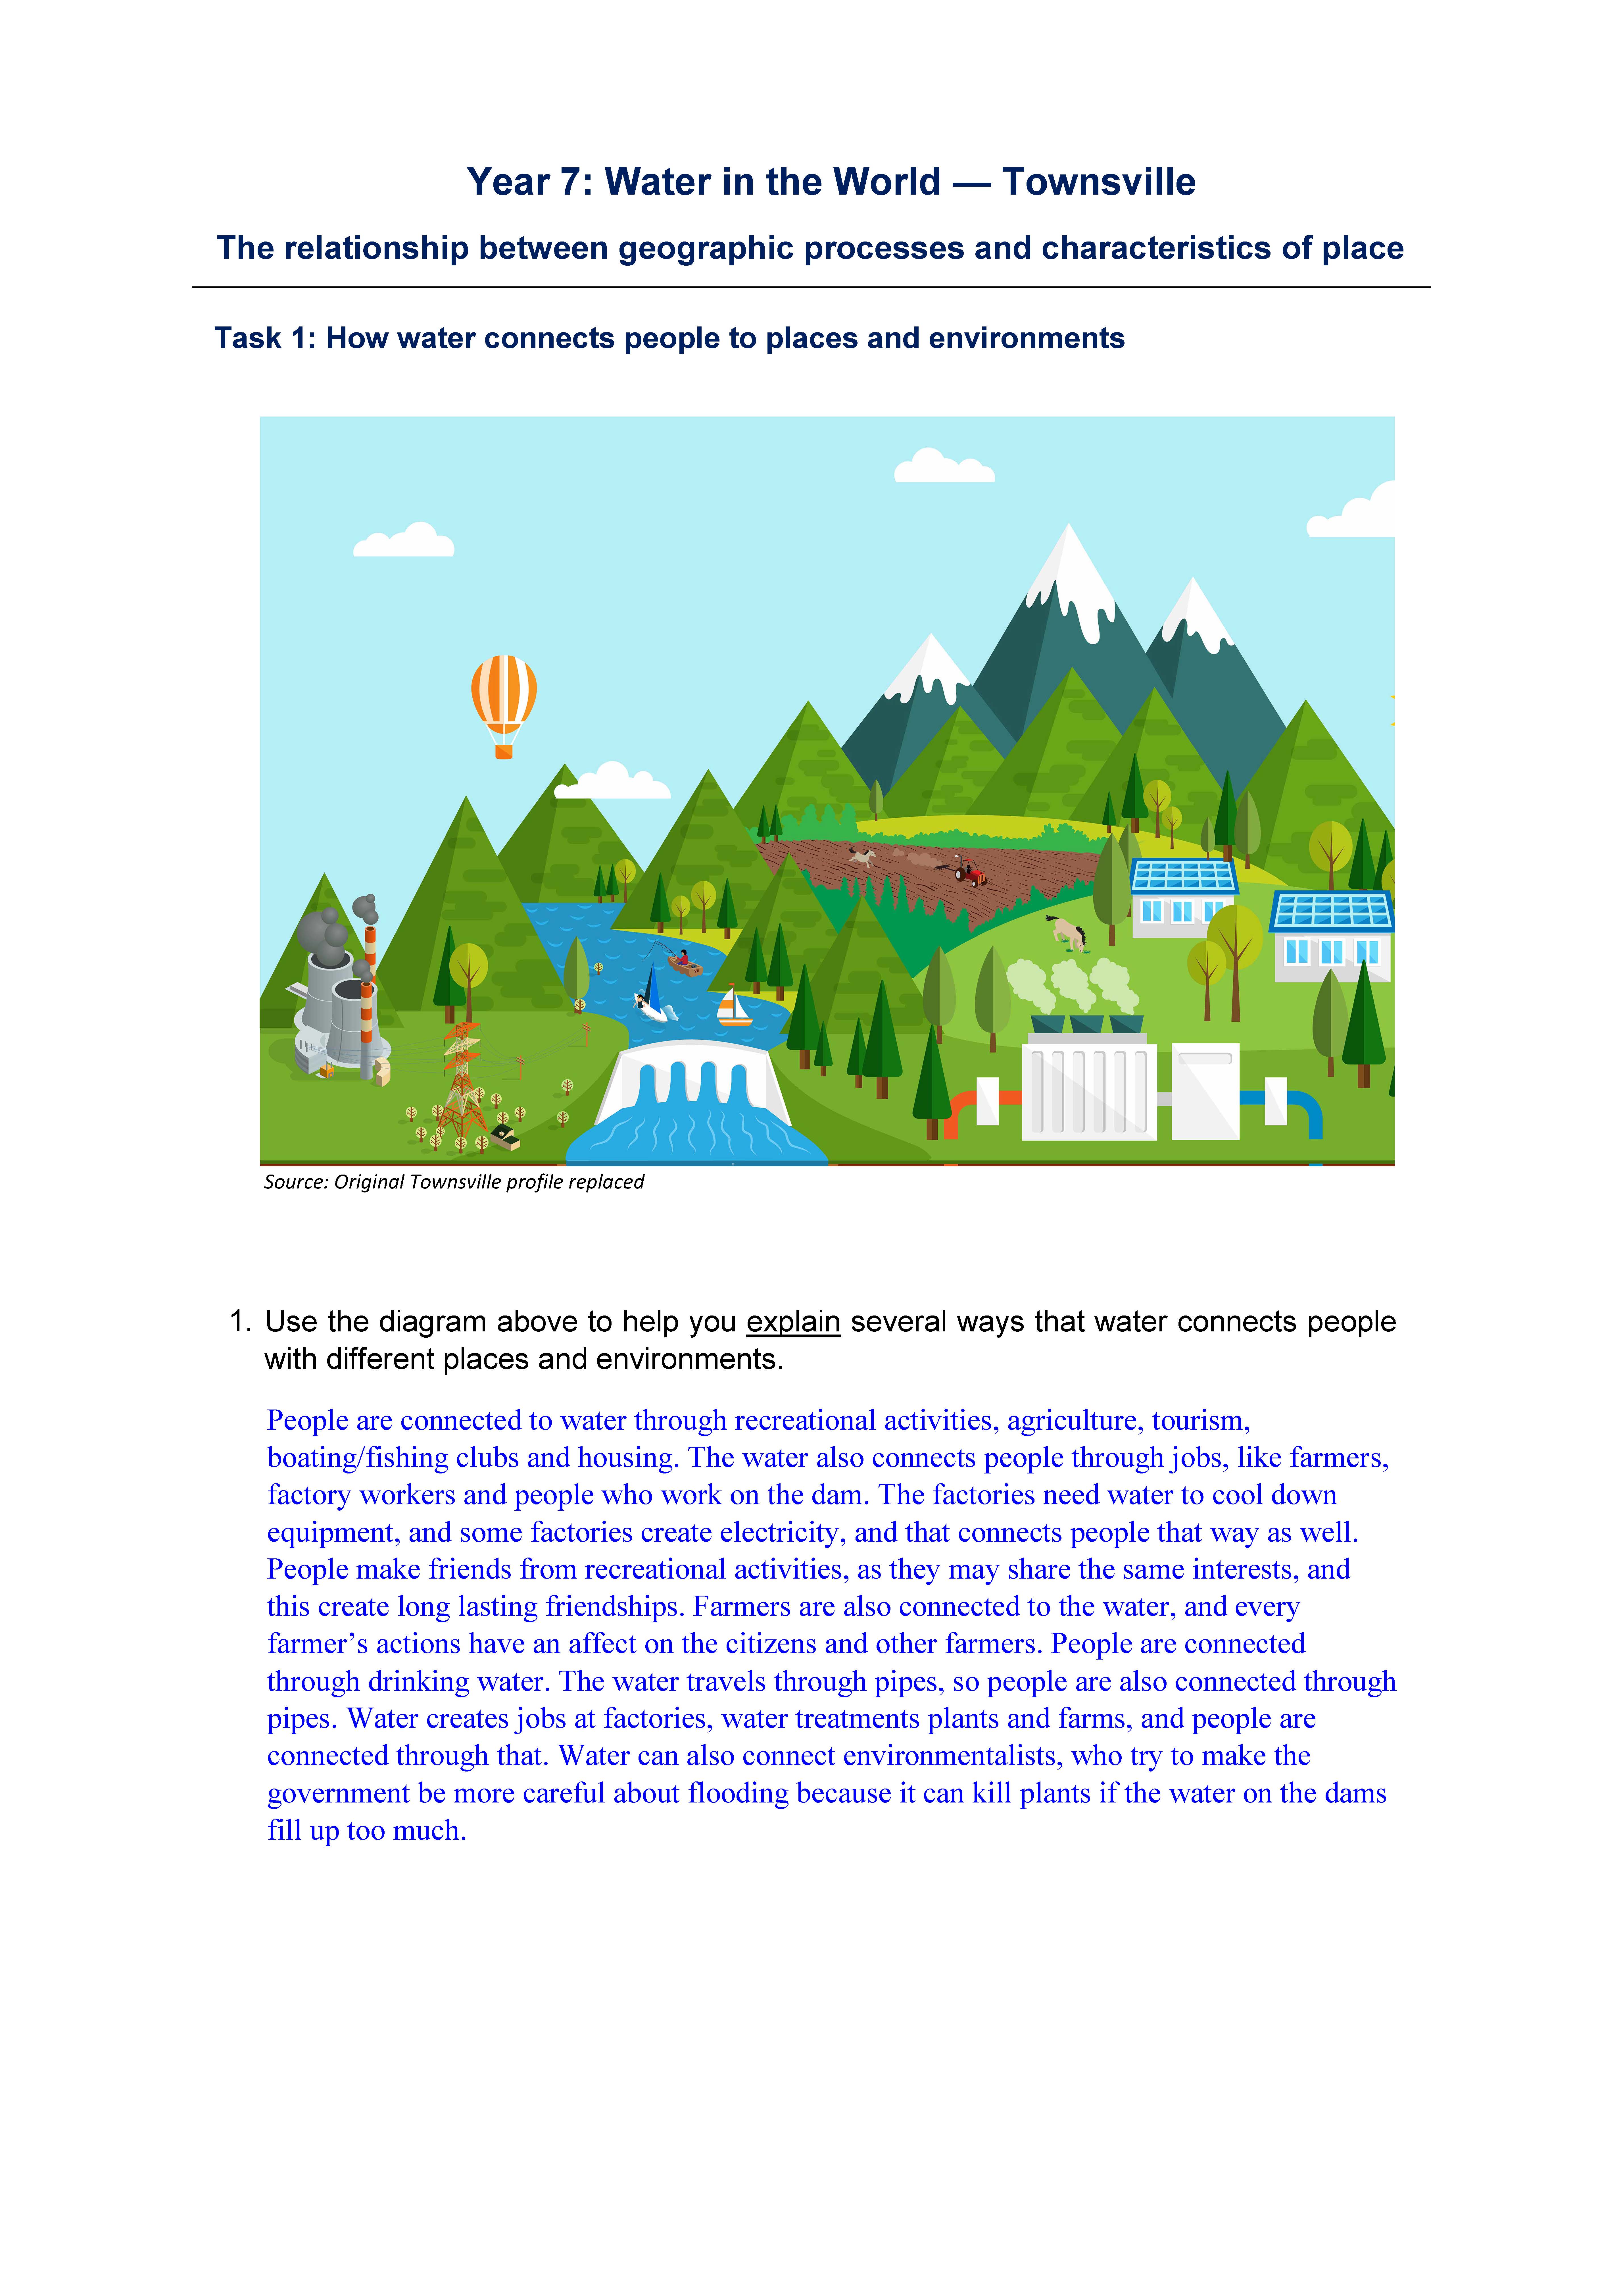 1
Annotation 1
Clearly articulates the overall connection between water, people, places and environments 2 Annotation 2
Explains a connection between people's use of water and its impact on the environment 3 Annotation 3
Predicts a geographical outcome using a conceptual argument
-
Annotations
-
1
Annotation 1
Clearly articulates the overall connection between water, people, places and environments -
2
Annotation 2
Explains a connection between people's use of water and its impact on the environment -
3
Annotation 3
Predicts a geographical outcome using a conceptual argument
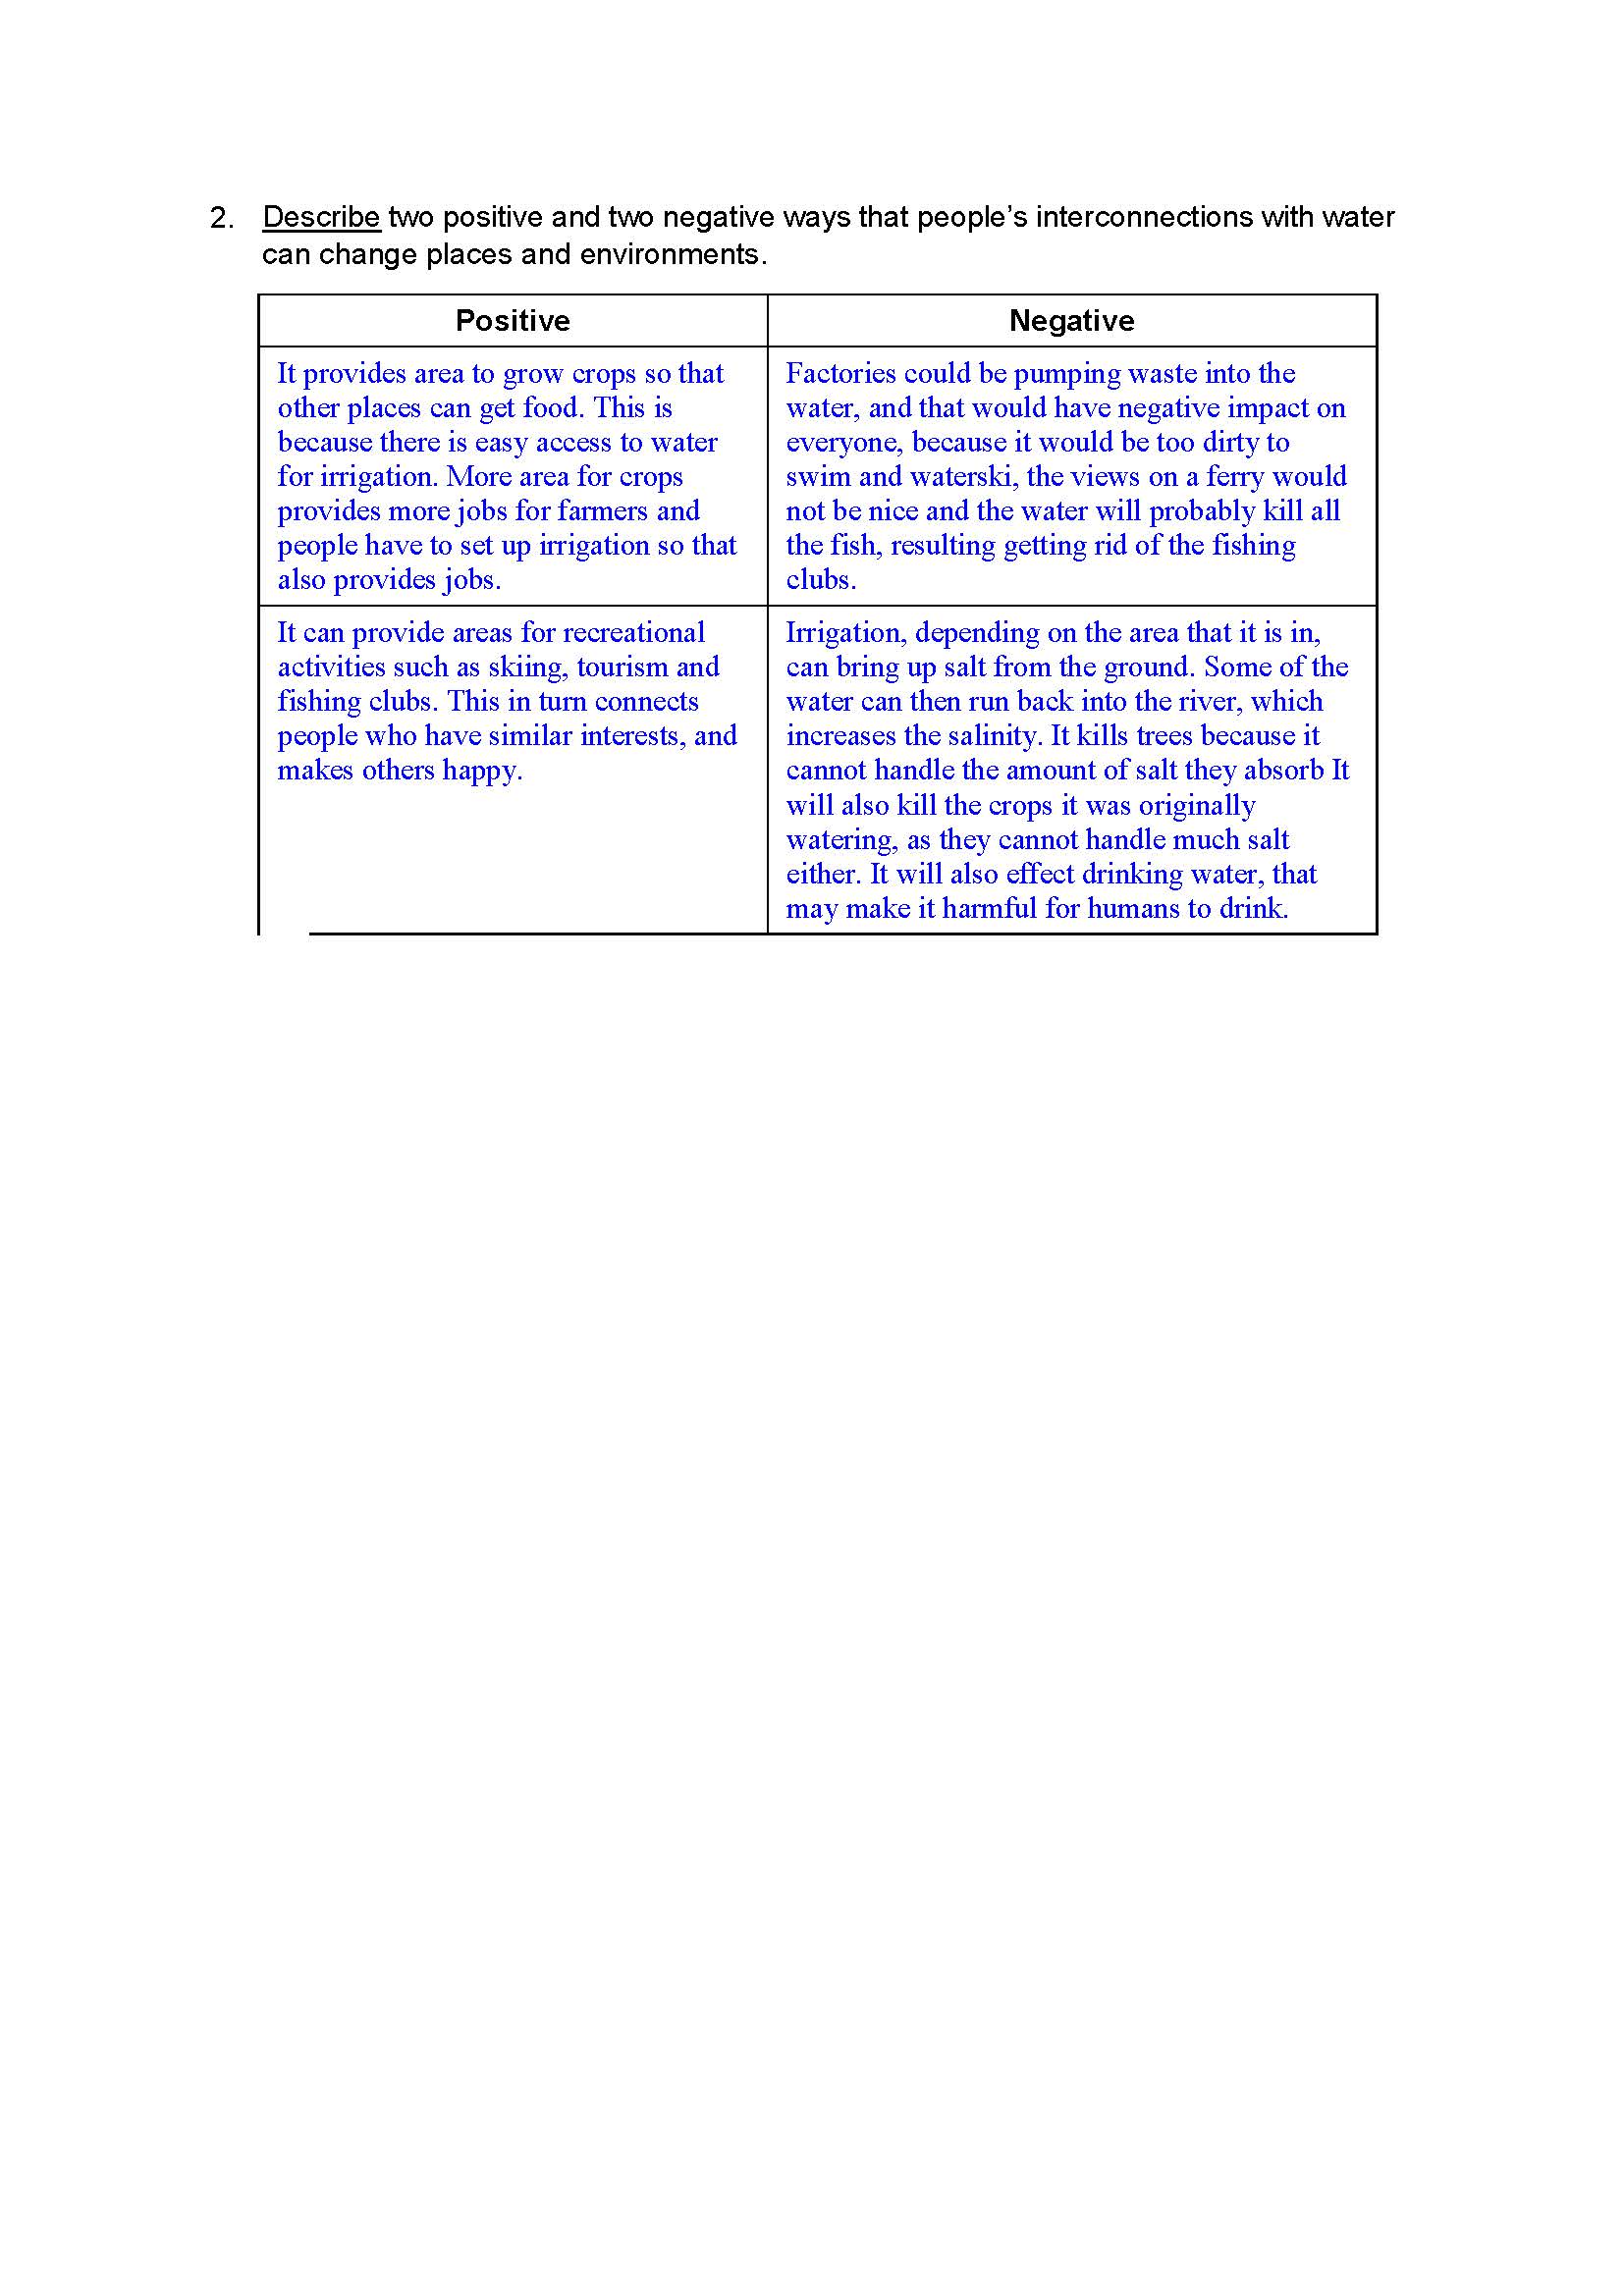 1
Annotation 1
Provides a comprehensive description of how interconnections change places and environments 2 Annotation 2
Uses relevant geographical terminology in appropriate context 3 Annotation 3
Draws conclusions using multiple connections from the diagram 4 Annotation 4
Describes in detail the interconnections between people's actions and the environment
-
Annotations
-
1
Annotation 1
Provides a comprehensive description of how interconnections change places and environments -
2
Annotation 2
Uses relevant geographical terminology in appropriate context -
3
Annotation 3
Draws conclusions using multiple connections from the diagram -
4
Annotation 4
Describes in detail the interconnections between people's actions and the environment
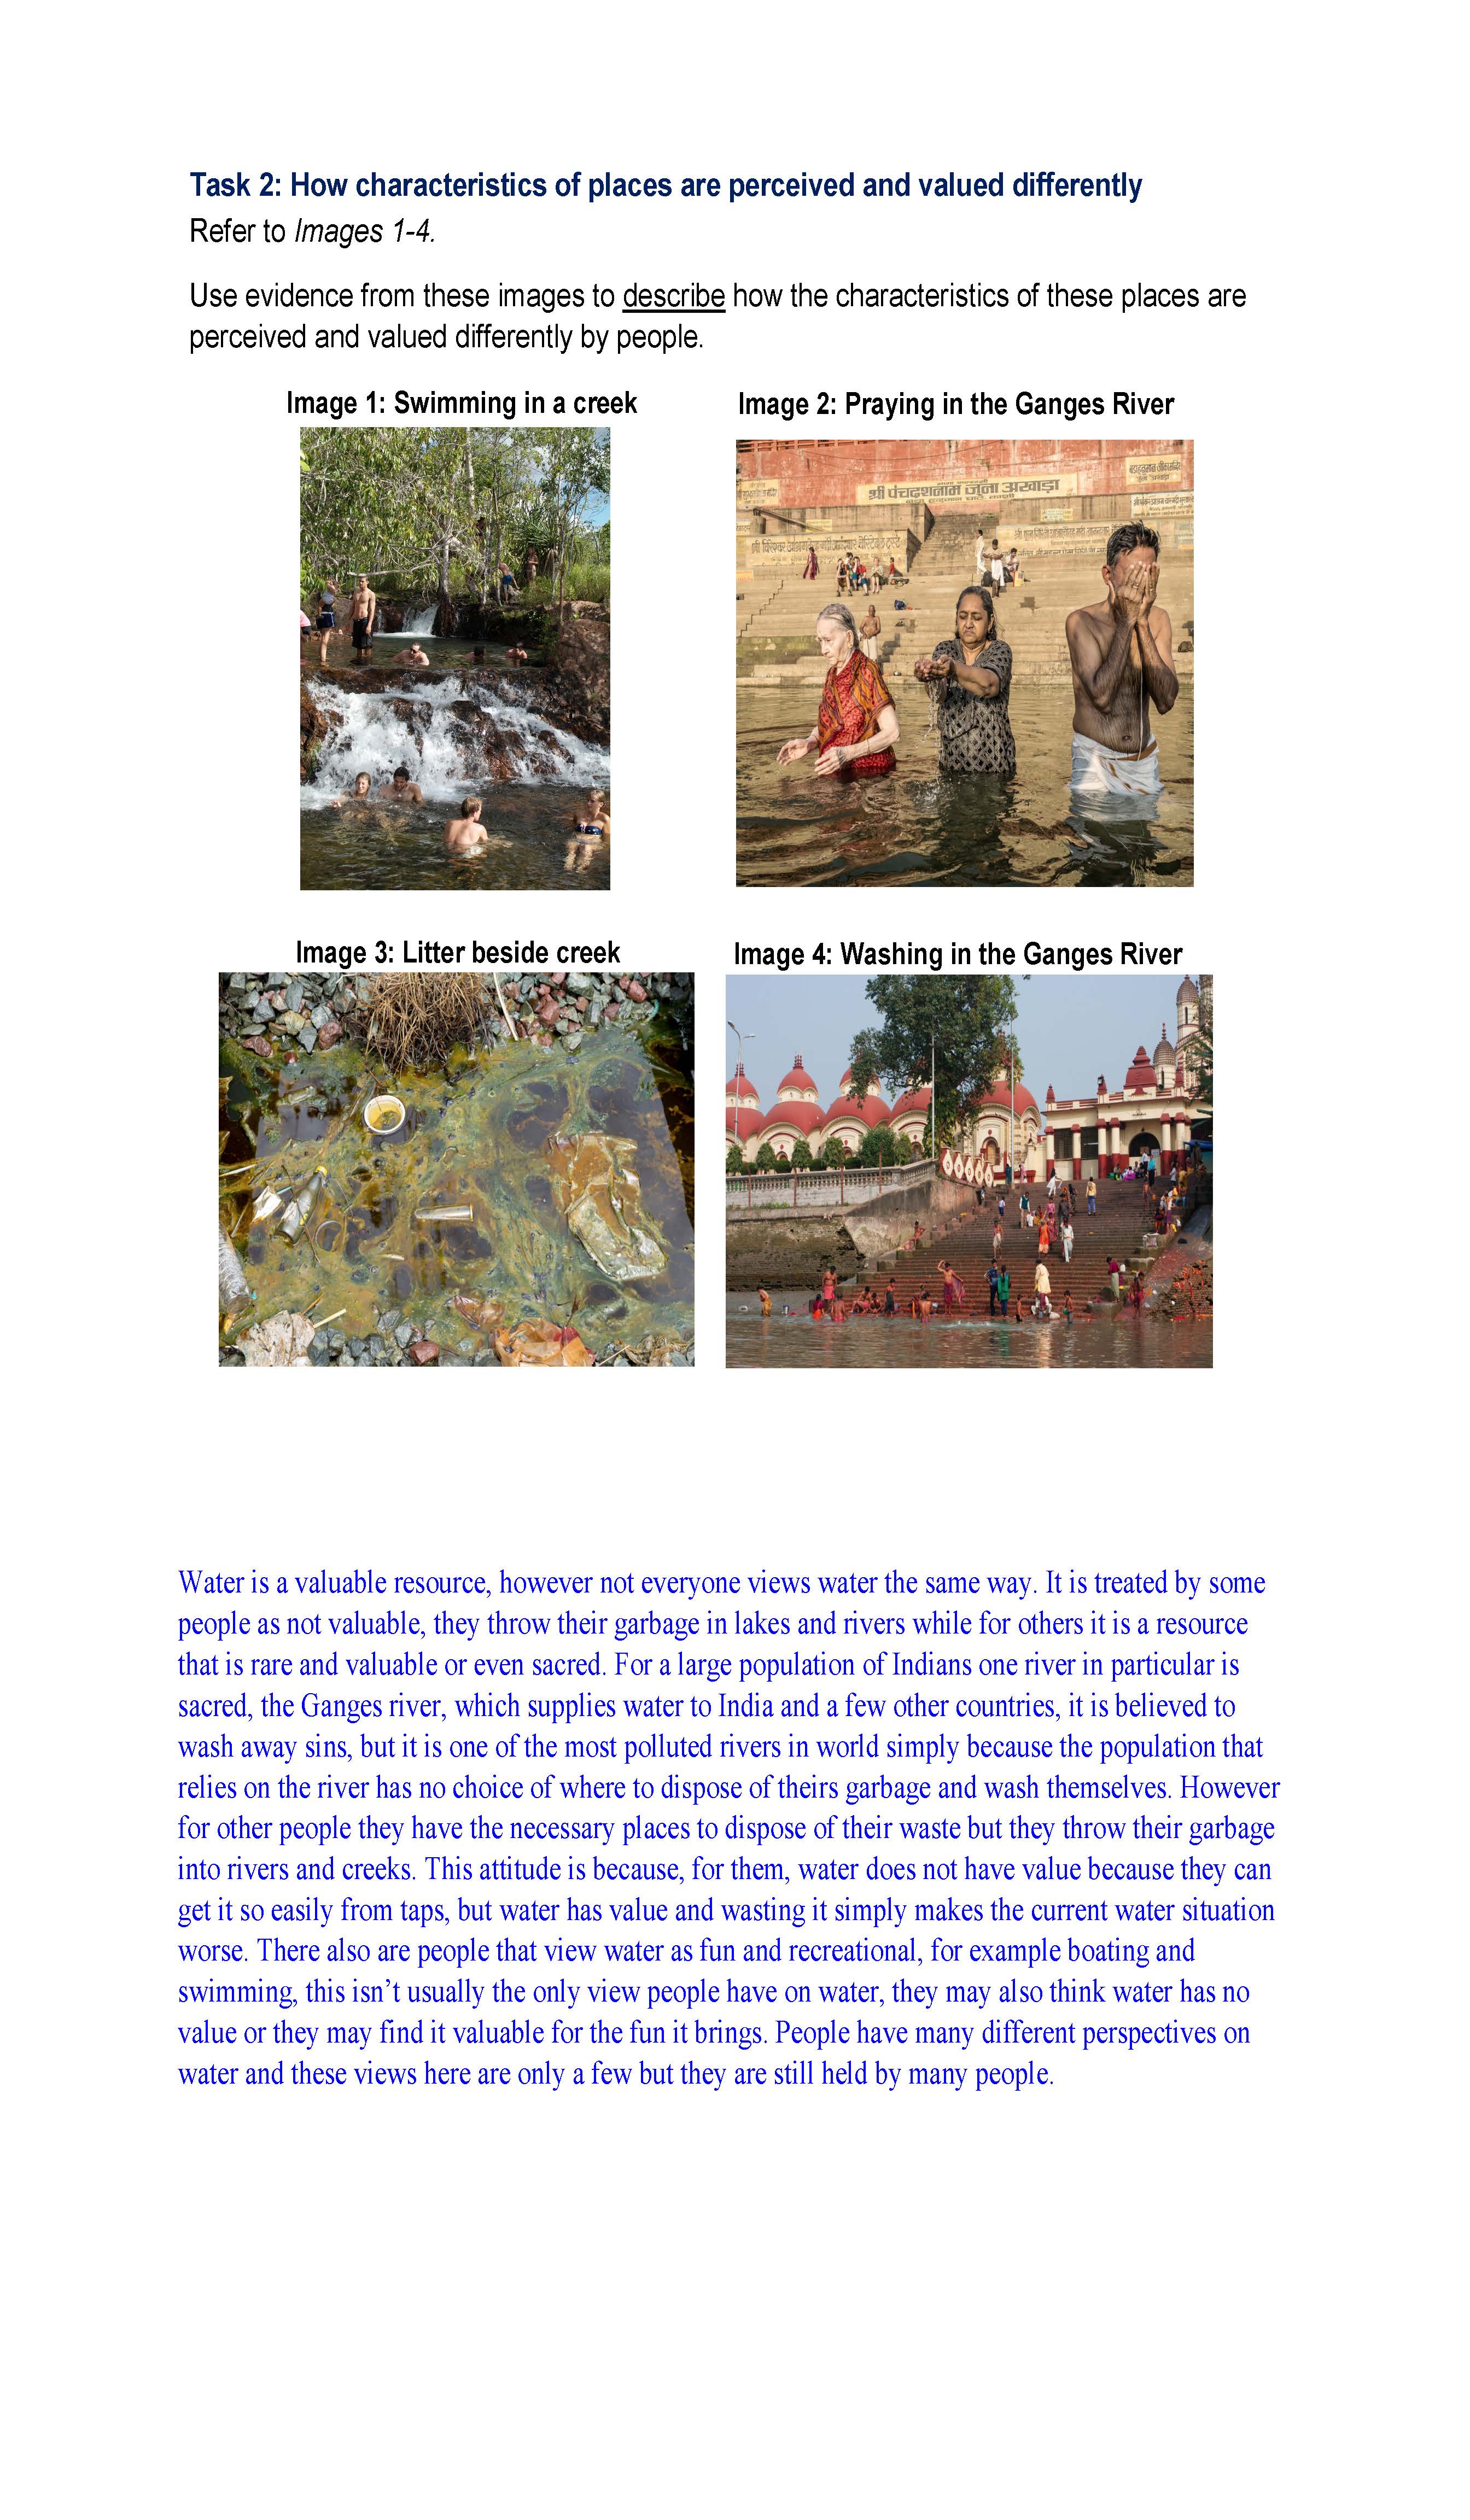 1
Annotation 1
Presents an argument about a geographical phenomenon 2 Annotation 2
Describes a reason why people may perceive and value water differently 3 Annotation 3
Explains the challenges associated with multiple uses of a single body of water 4 Annotation 4
Proposes an explanation for negative use of water 5 Annotation 5
Synthesises evidence from multiple sources 6 Annotation 6
Draws a conclusion about how people view water differently
-
Annotations
-
1
Annotation 1
Presents an argument about a geographical phenomenon -
2
Annotation 2
Describes a reason why people may perceive and value water differently -
3
Annotation 3
Explains the challenges associated with multiple uses of a single body of water -
4
Annotation 4
Proposes an explanation for negative use of water -
5
Annotation 5
Synthesises evidence from multiple sources -
6
Annotation 6
Draws a conclusion about how people view water differently
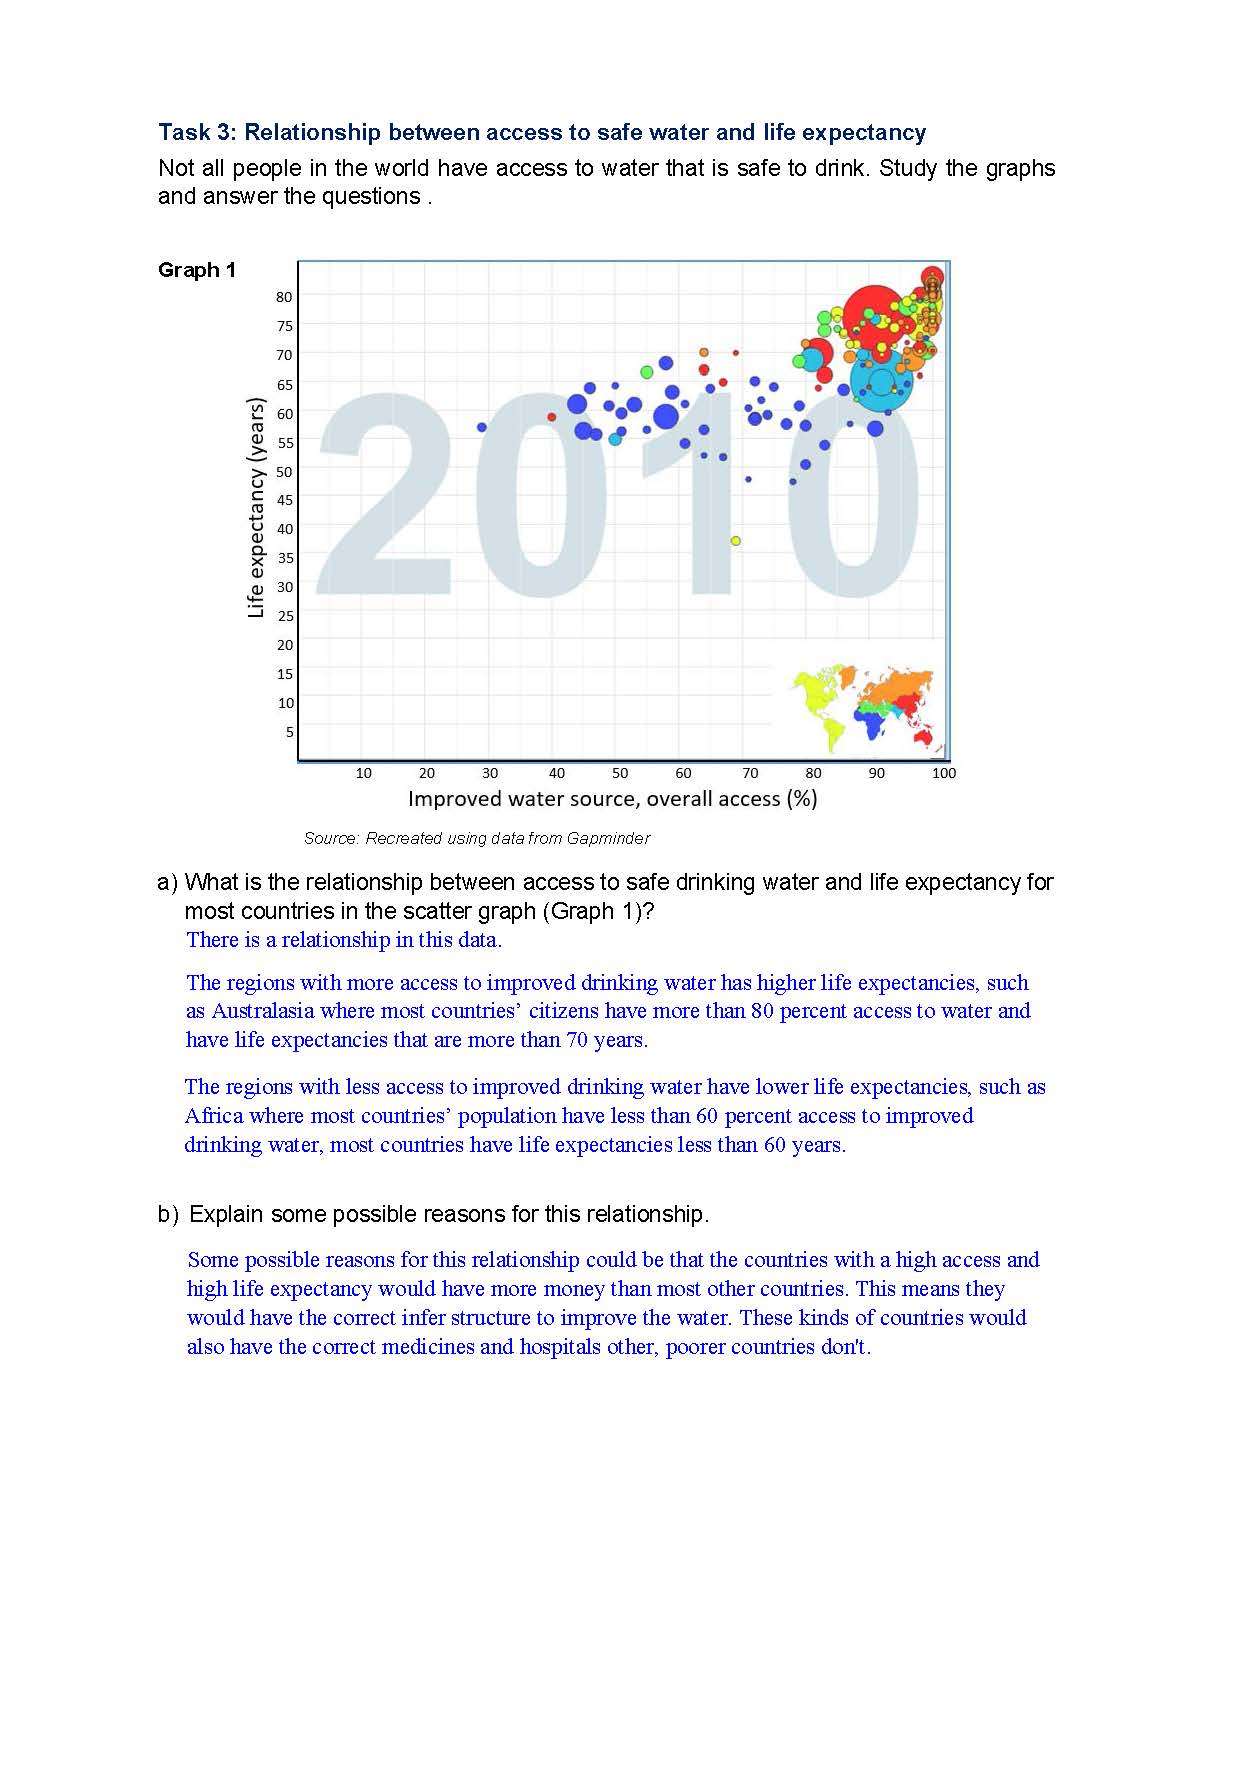 1
Annotation 1
Describes accurately a geographic trend, citing specific data from the graph 2 Annotation 2
Identifies relationships between variables (access to safe drinking water and life expectancy) 3 Annotation 3
Describes accurately a geographic trend, citing specific data from the graph 4 Annotation 4
Uses relevant geographical terminology 5 Annotation 5
Syntheses data to draw a detailed conclusion 6 Annotation 6
Explains how access to safe drinking water is connected to life expectancy, citing examples from the graph
-
Annotations
-
1
Annotation 1
Describes accurately a geographic trend, citing specific data from the graph -
2
Annotation 2
Identifies relationships between variables (access to safe drinking water and life expectancy) -
3
Annotation 3
Describes accurately a geographic trend, citing specific data from the graph -
4
Annotation 4
Uses relevant geographical terminology -
5
Annotation 5
Syntheses data to draw a detailed conclusion -
6
Annotation 6
Explains how access to safe drinking water is connected to life expectancy, citing examples from the graph
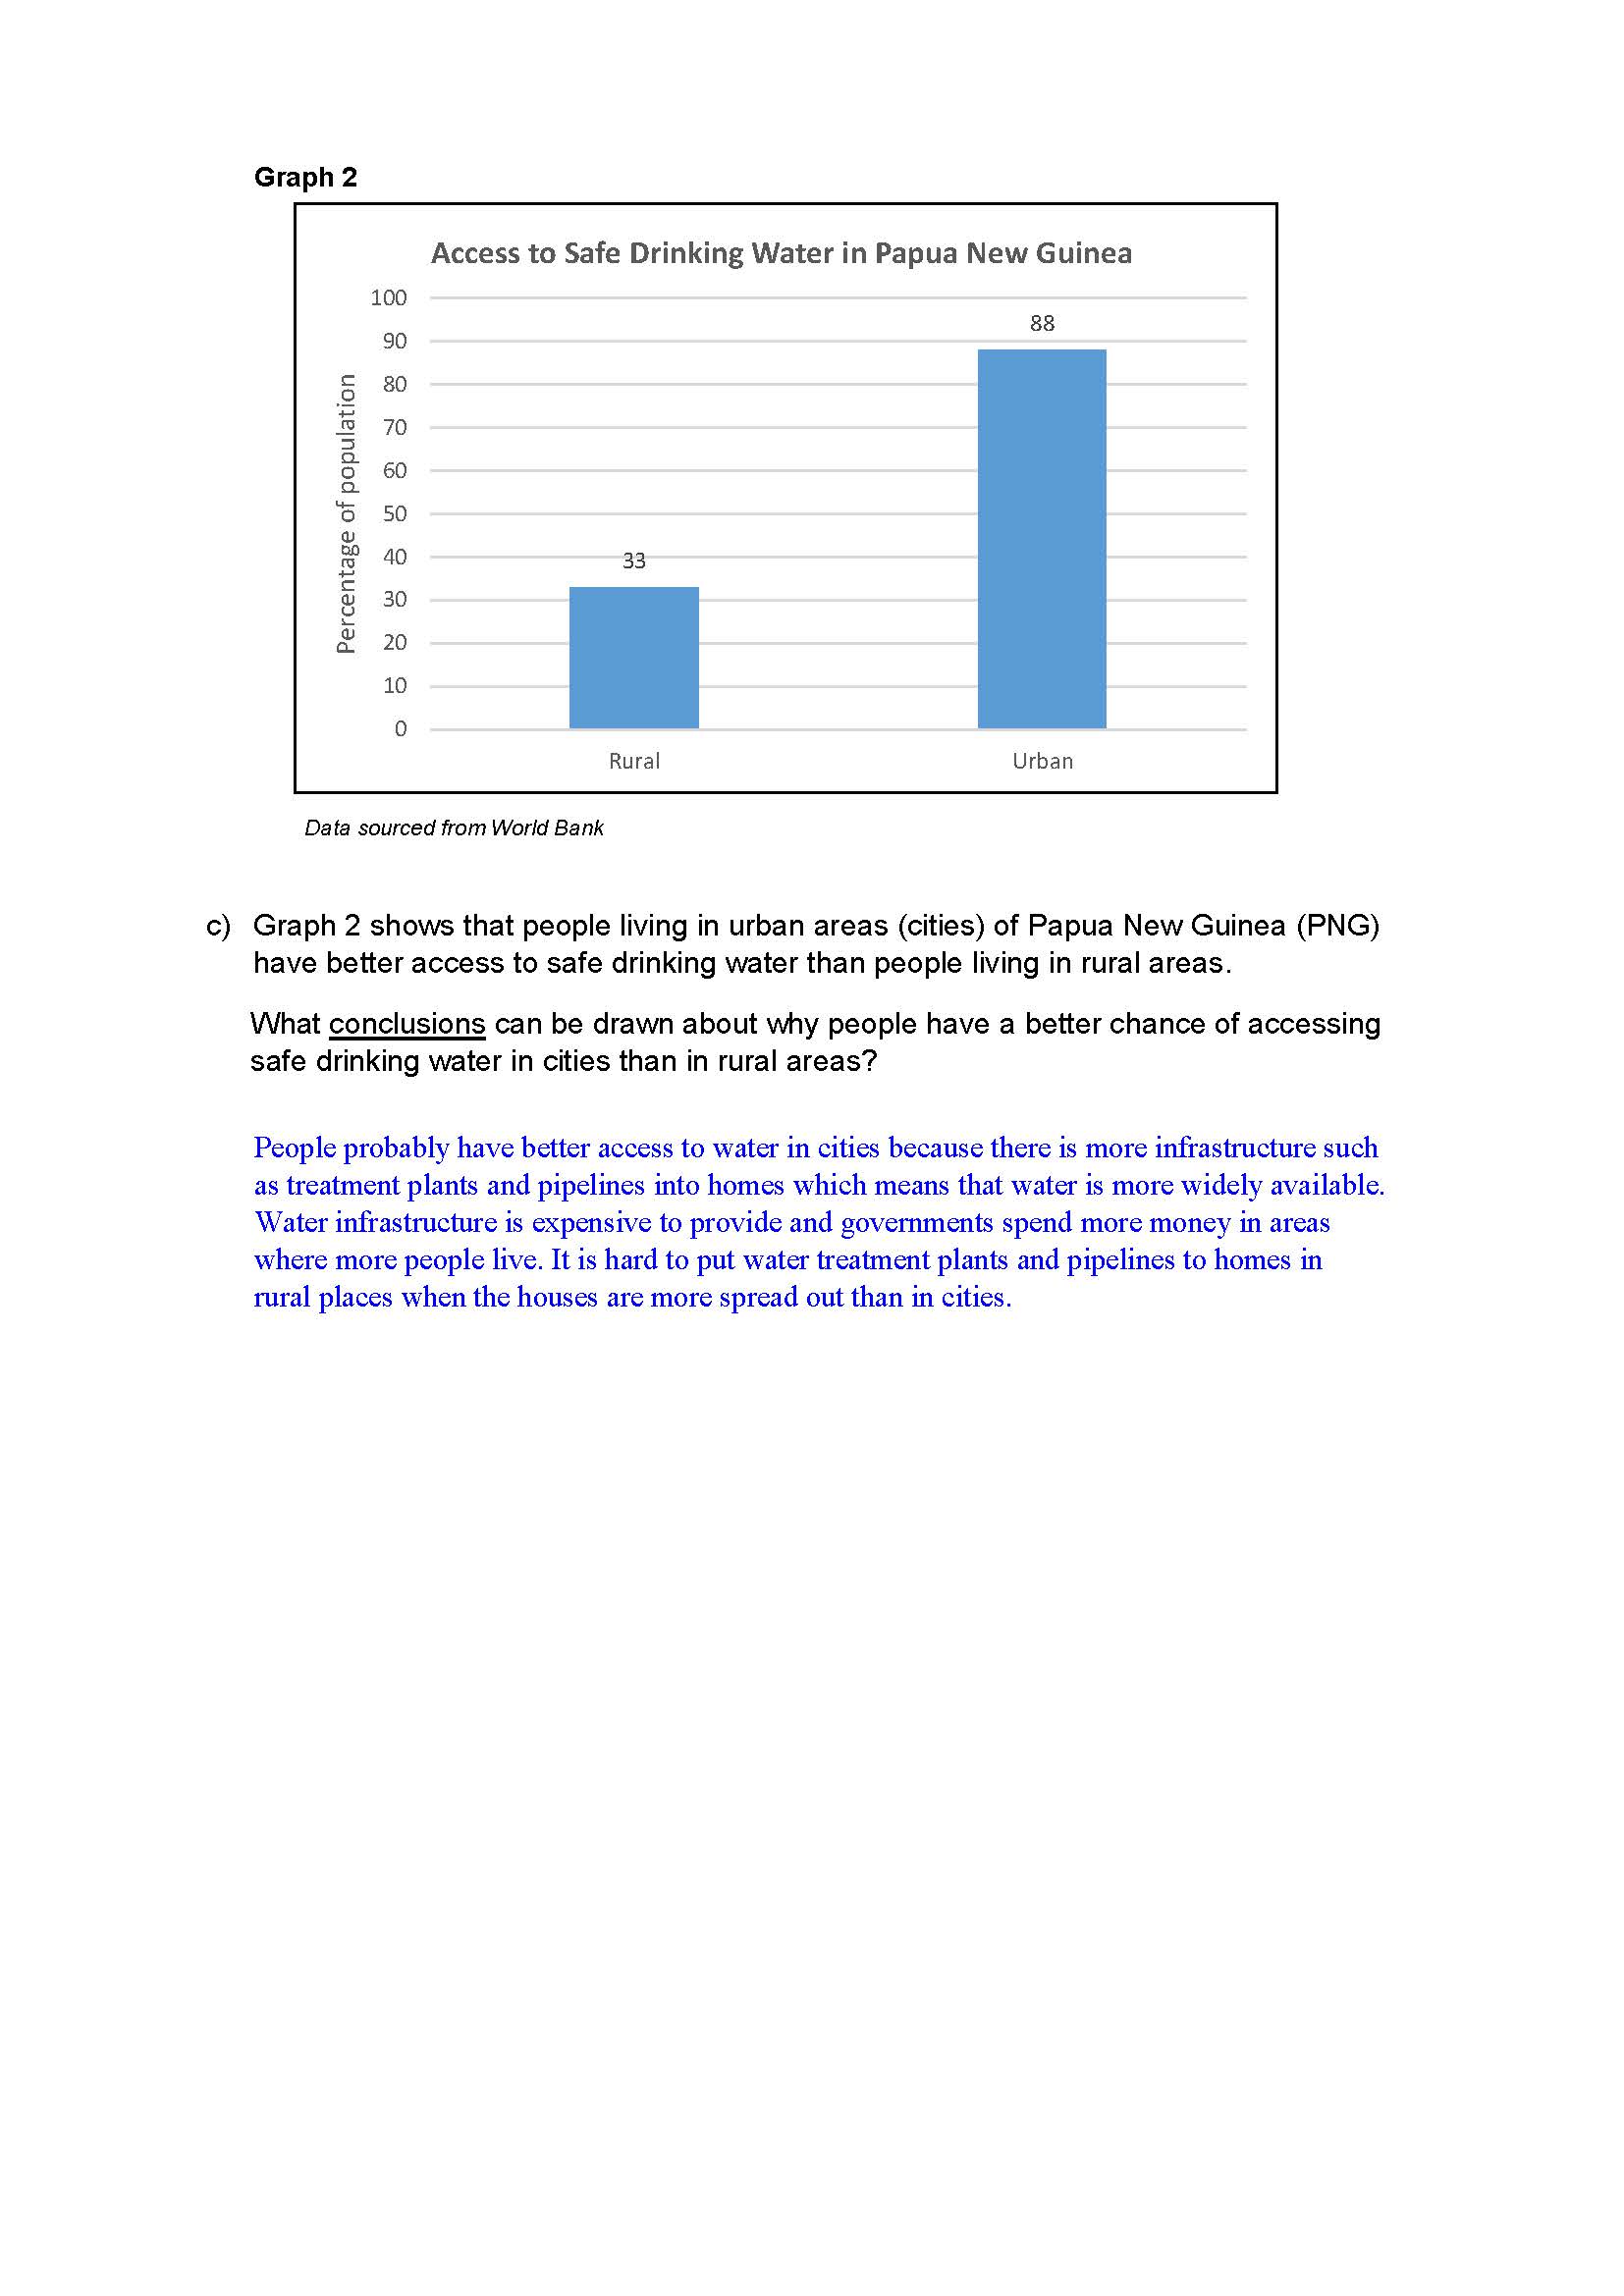 1
Annotation 1
Uses relevant geographical terminology 2 Annotation 2
Draws a reasoned, detailed conclusion based on the data provided in the graph, using examples
-
Annotations
-
1
Annotation 1
Uses relevant geographical terminology -
2
Annotation 2
Draws a reasoned, detailed conclusion based on the data provided in the graph, using examples
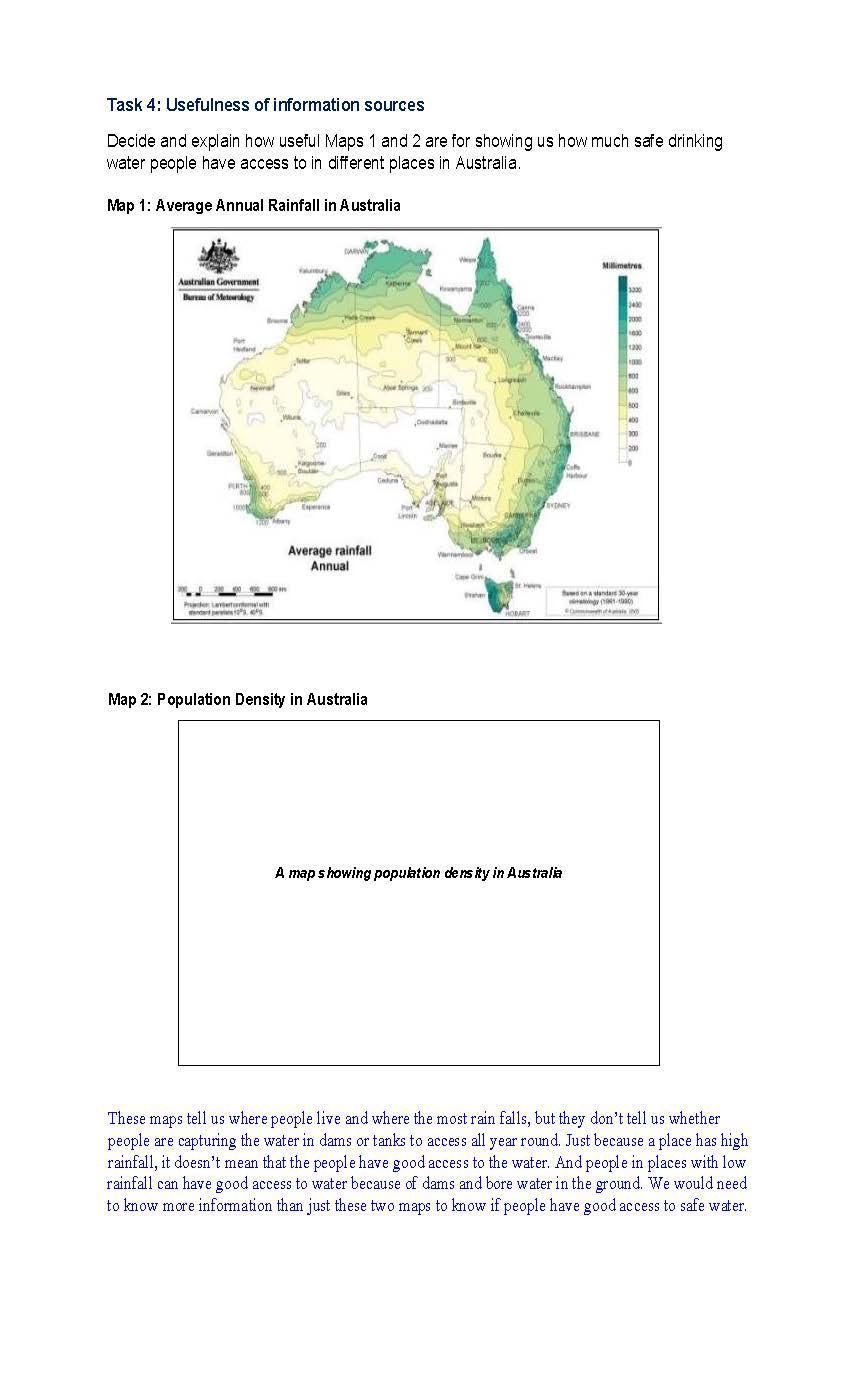 1
Annotation 1
Identifies the purpose of different maps 2 Annotation 2
Justifies the need for more information by acknowledging each map's limitations 3 Annotation 3
Uses both maps to explain in detail trends and relationships about rainfall and population
-
Annotations
-
1
Annotation 1
Identifies the purpose of different maps -
2
Annotation 2
Justifies the need for more information by acknowledging each map's limitations -
3
Annotation 3
Uses both maps to explain in detail trends and relationships about rainfall and population
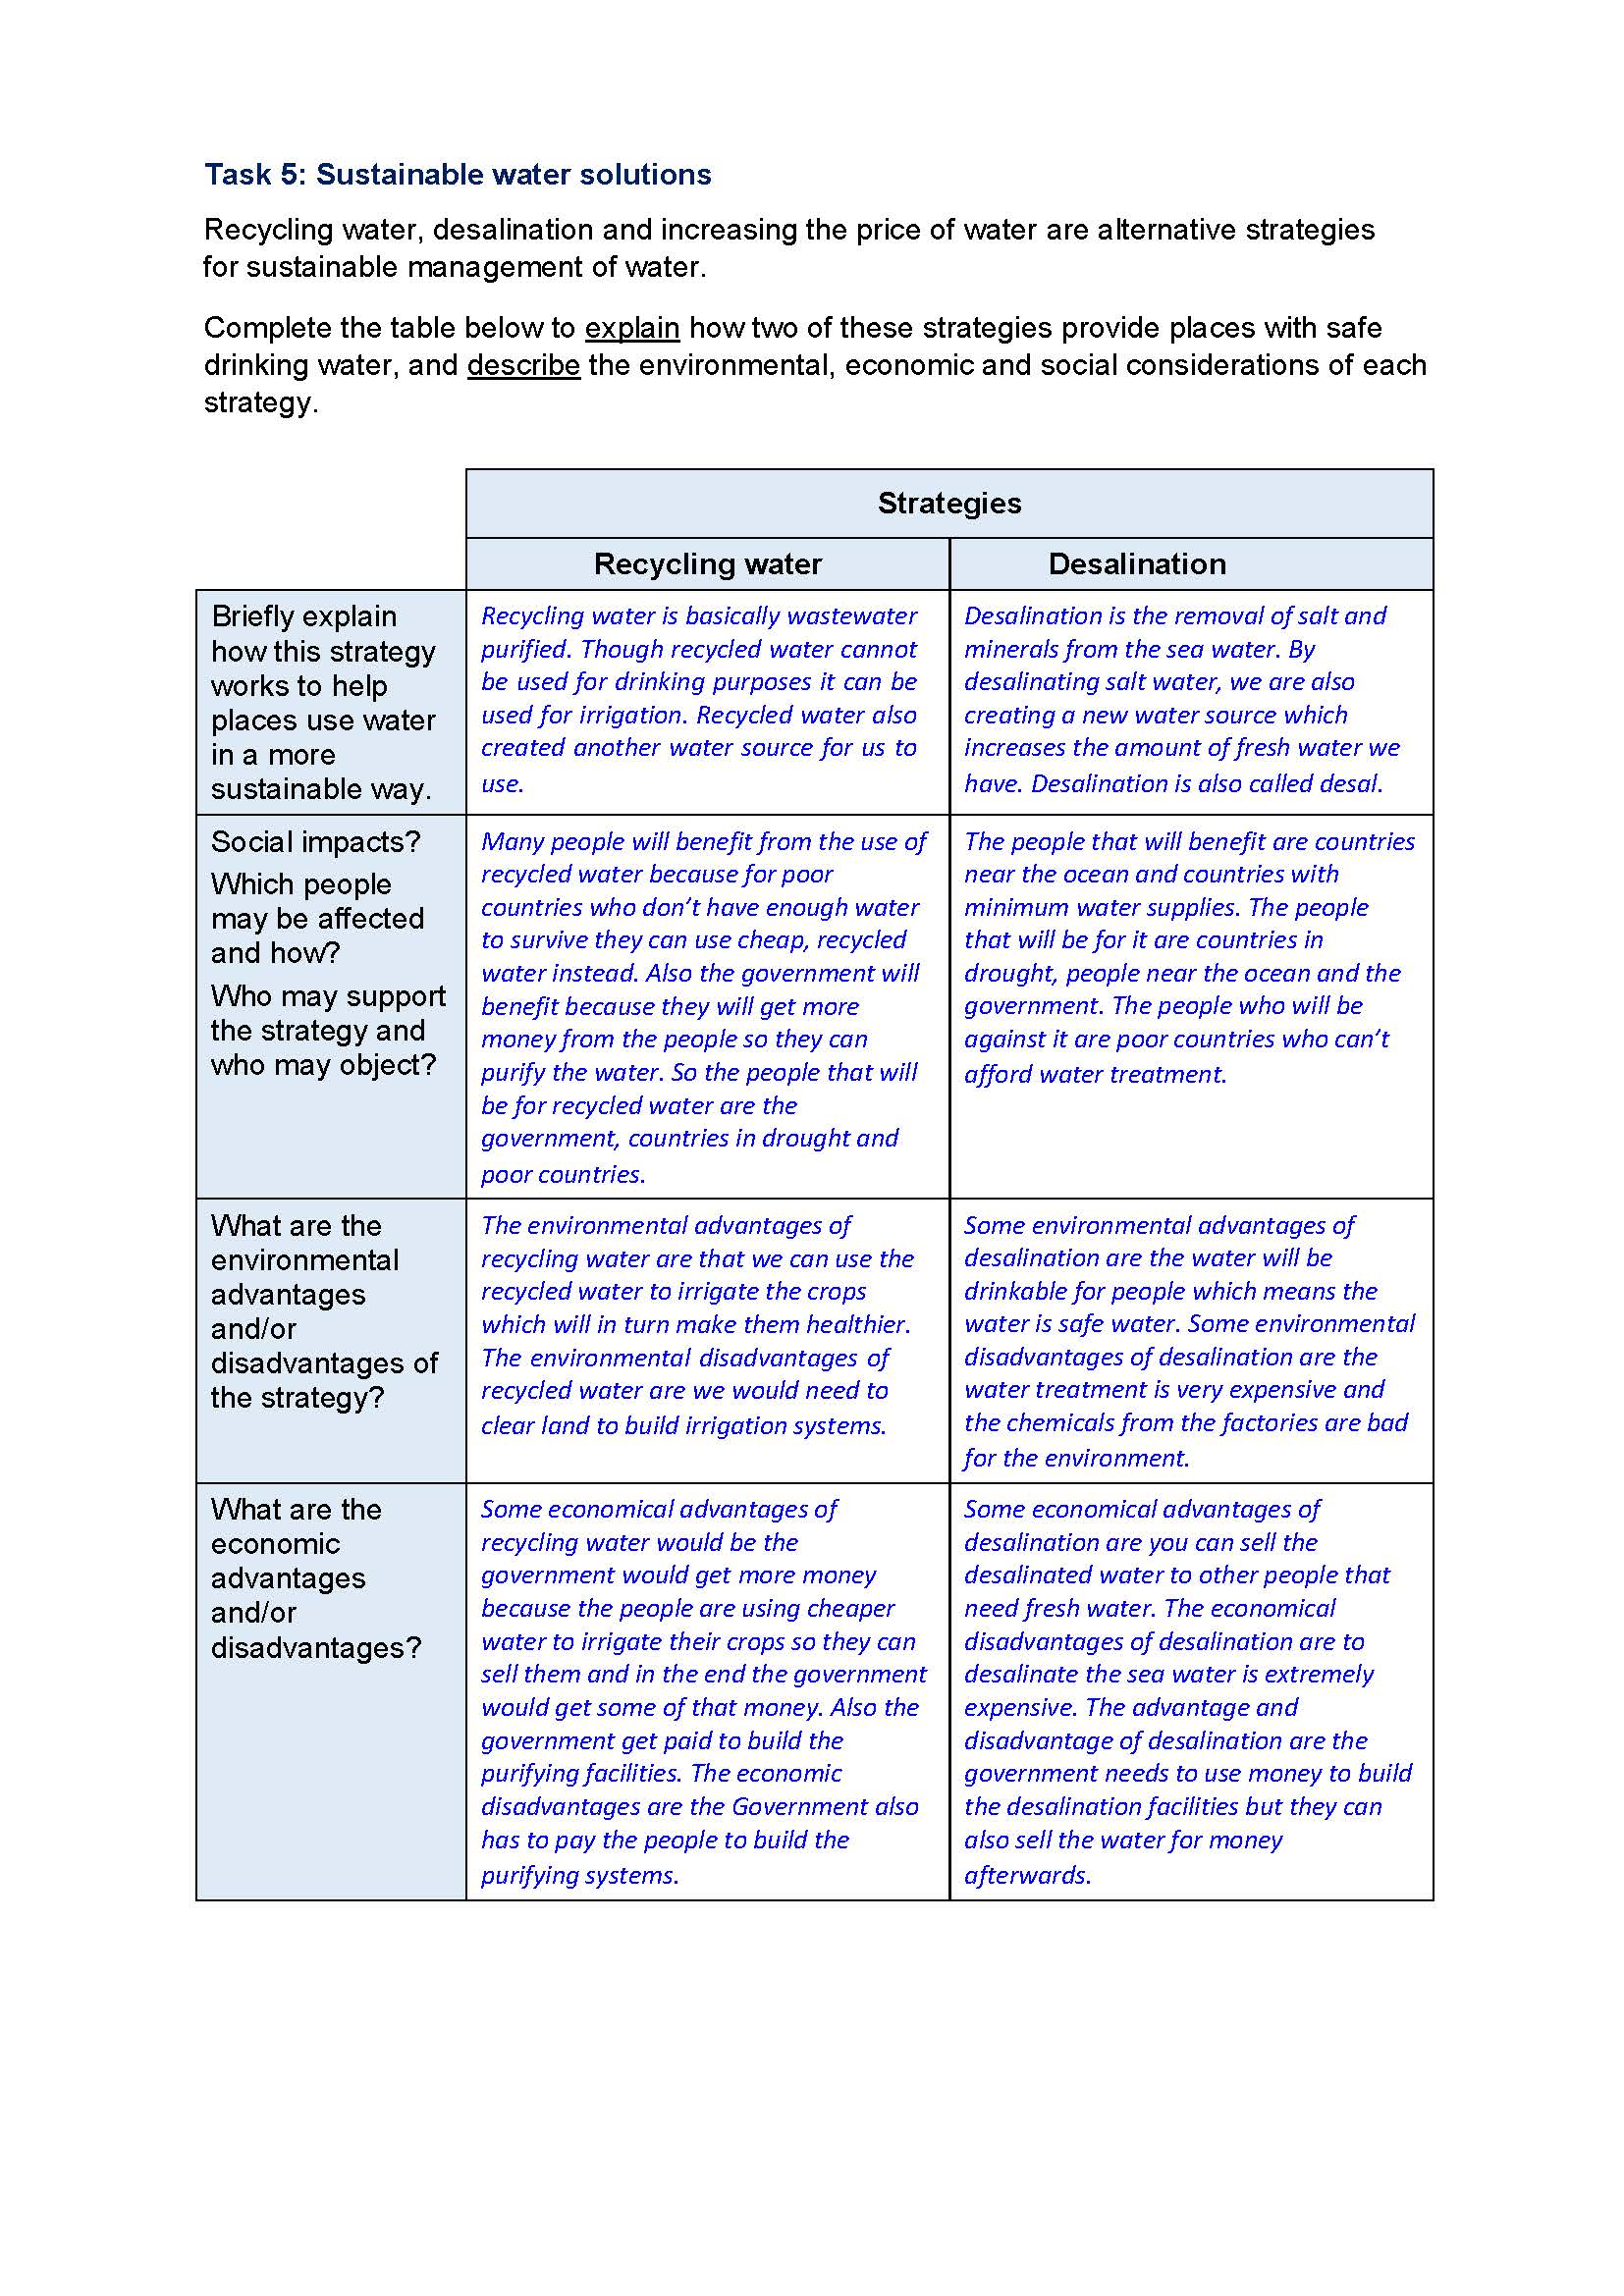 1
Annotation 1
Identifies strategies to address the challenge of water sustainability 2 Annotation 2
Explains in detail the processes of water recycling and desalination 3 Annotation 3
Identifies possible positive and negative social and economic factors linked to recycled water and desalination 4 Annotation 4
Connects sustainable strategies for water to society and the environment 5 Annotation 5
Outlines positive and negative economic impacts associated with water recycling and desalination, using examples 6 Annotation 6
Identifies and explains a connection between desalination, the economy and the environment 7 Annotation 7
Explains economic advantages and disadvantages of water recycling and desalination on society and the economy, using specific examples 8 Annotation 8
Draws conclusions about the effects of water recycling and desalination
-
Annotations
-
1
Annotation 1
Identifies strategies to address the challenge of water sustainability -
2
Annotation 2
Explains in detail the processes of water recycling and desalination -
3
Annotation 3
Identifies possible positive and negative social and economic factors linked to recycled water and desalination -
4
Annotation 4
Connects sustainable strategies for water to society and the environment -
5
Annotation 5
Outlines positive and negative economic impacts associated with water recycling and desalination, using examples -
6
Annotation 6
Identifies and explains a connection between desalination, the economy and the environment -
7
Annotation 7
Explains economic advantages and disadvantages of water recycling and desalination on society and the economy, using specific examples -
8
Annotation 8
Draws conclusions about the effects of water recycling and desalination


