Data analysis: Water in the world
Summary of task
Over a period of six weeks, students explored how water connects places, environments and people. Students used digital technologies to present the process of orographic rainfall and explain how it influences the characteristics on either side of a mountain.
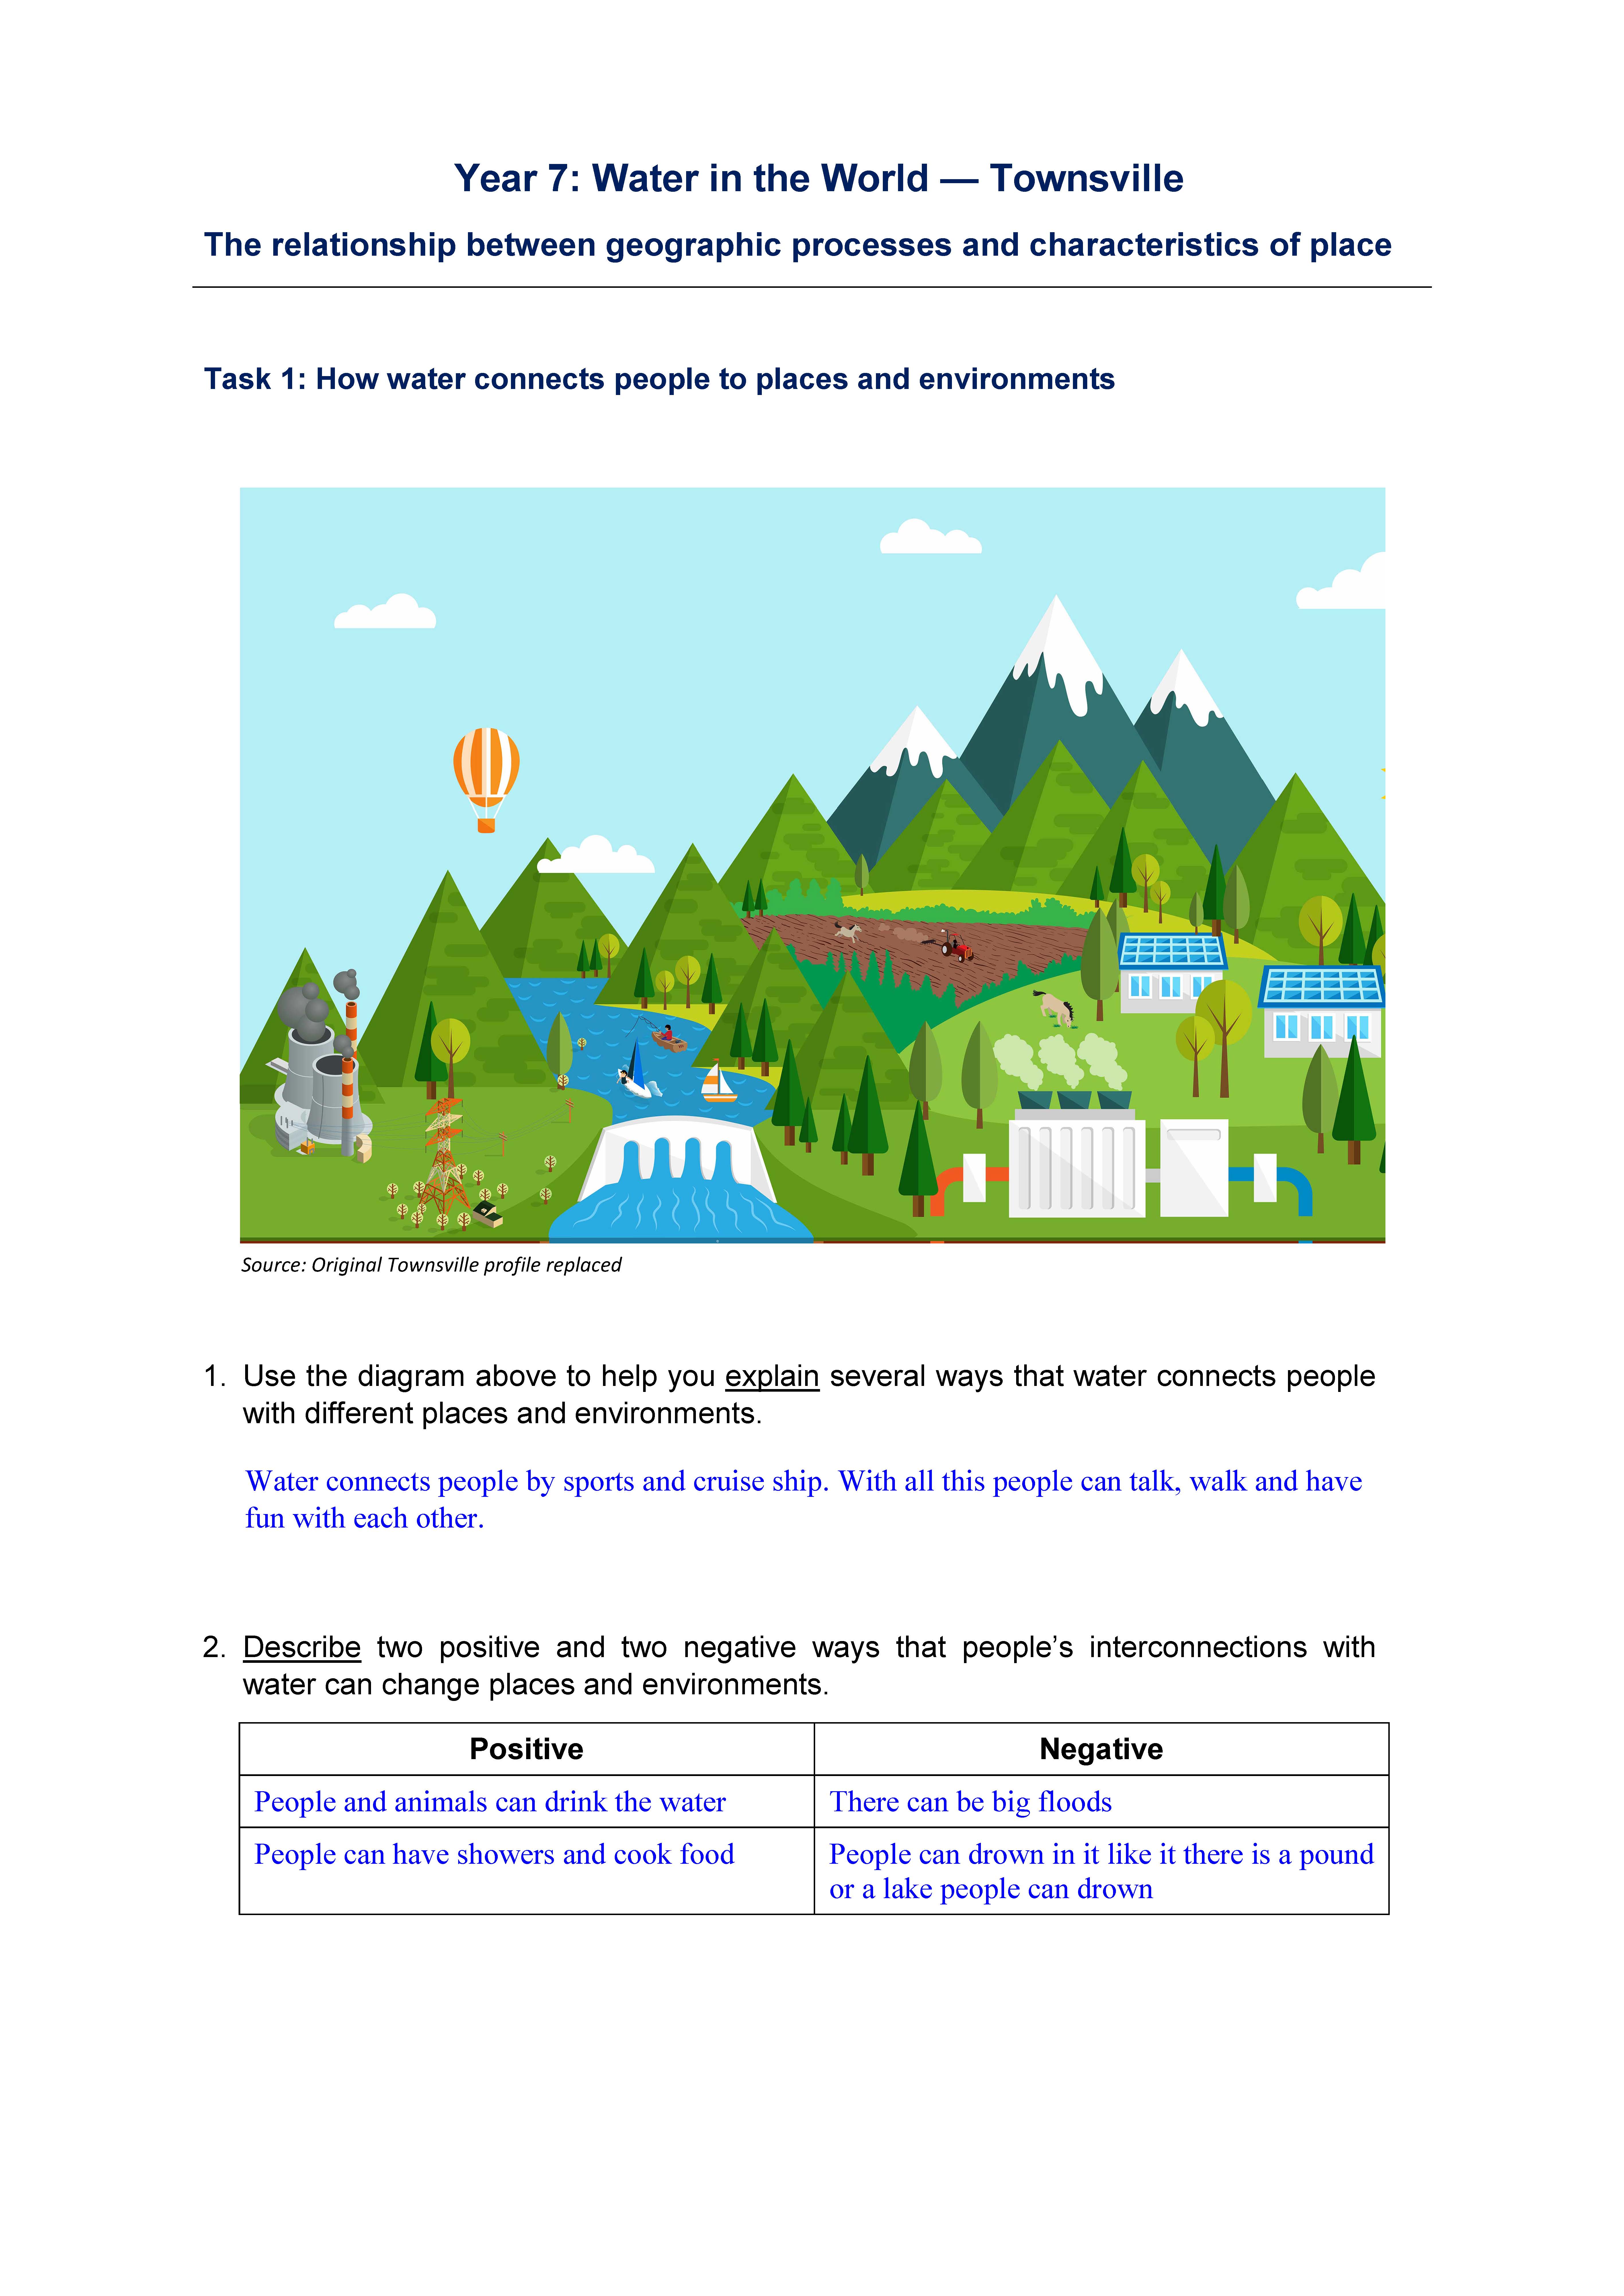
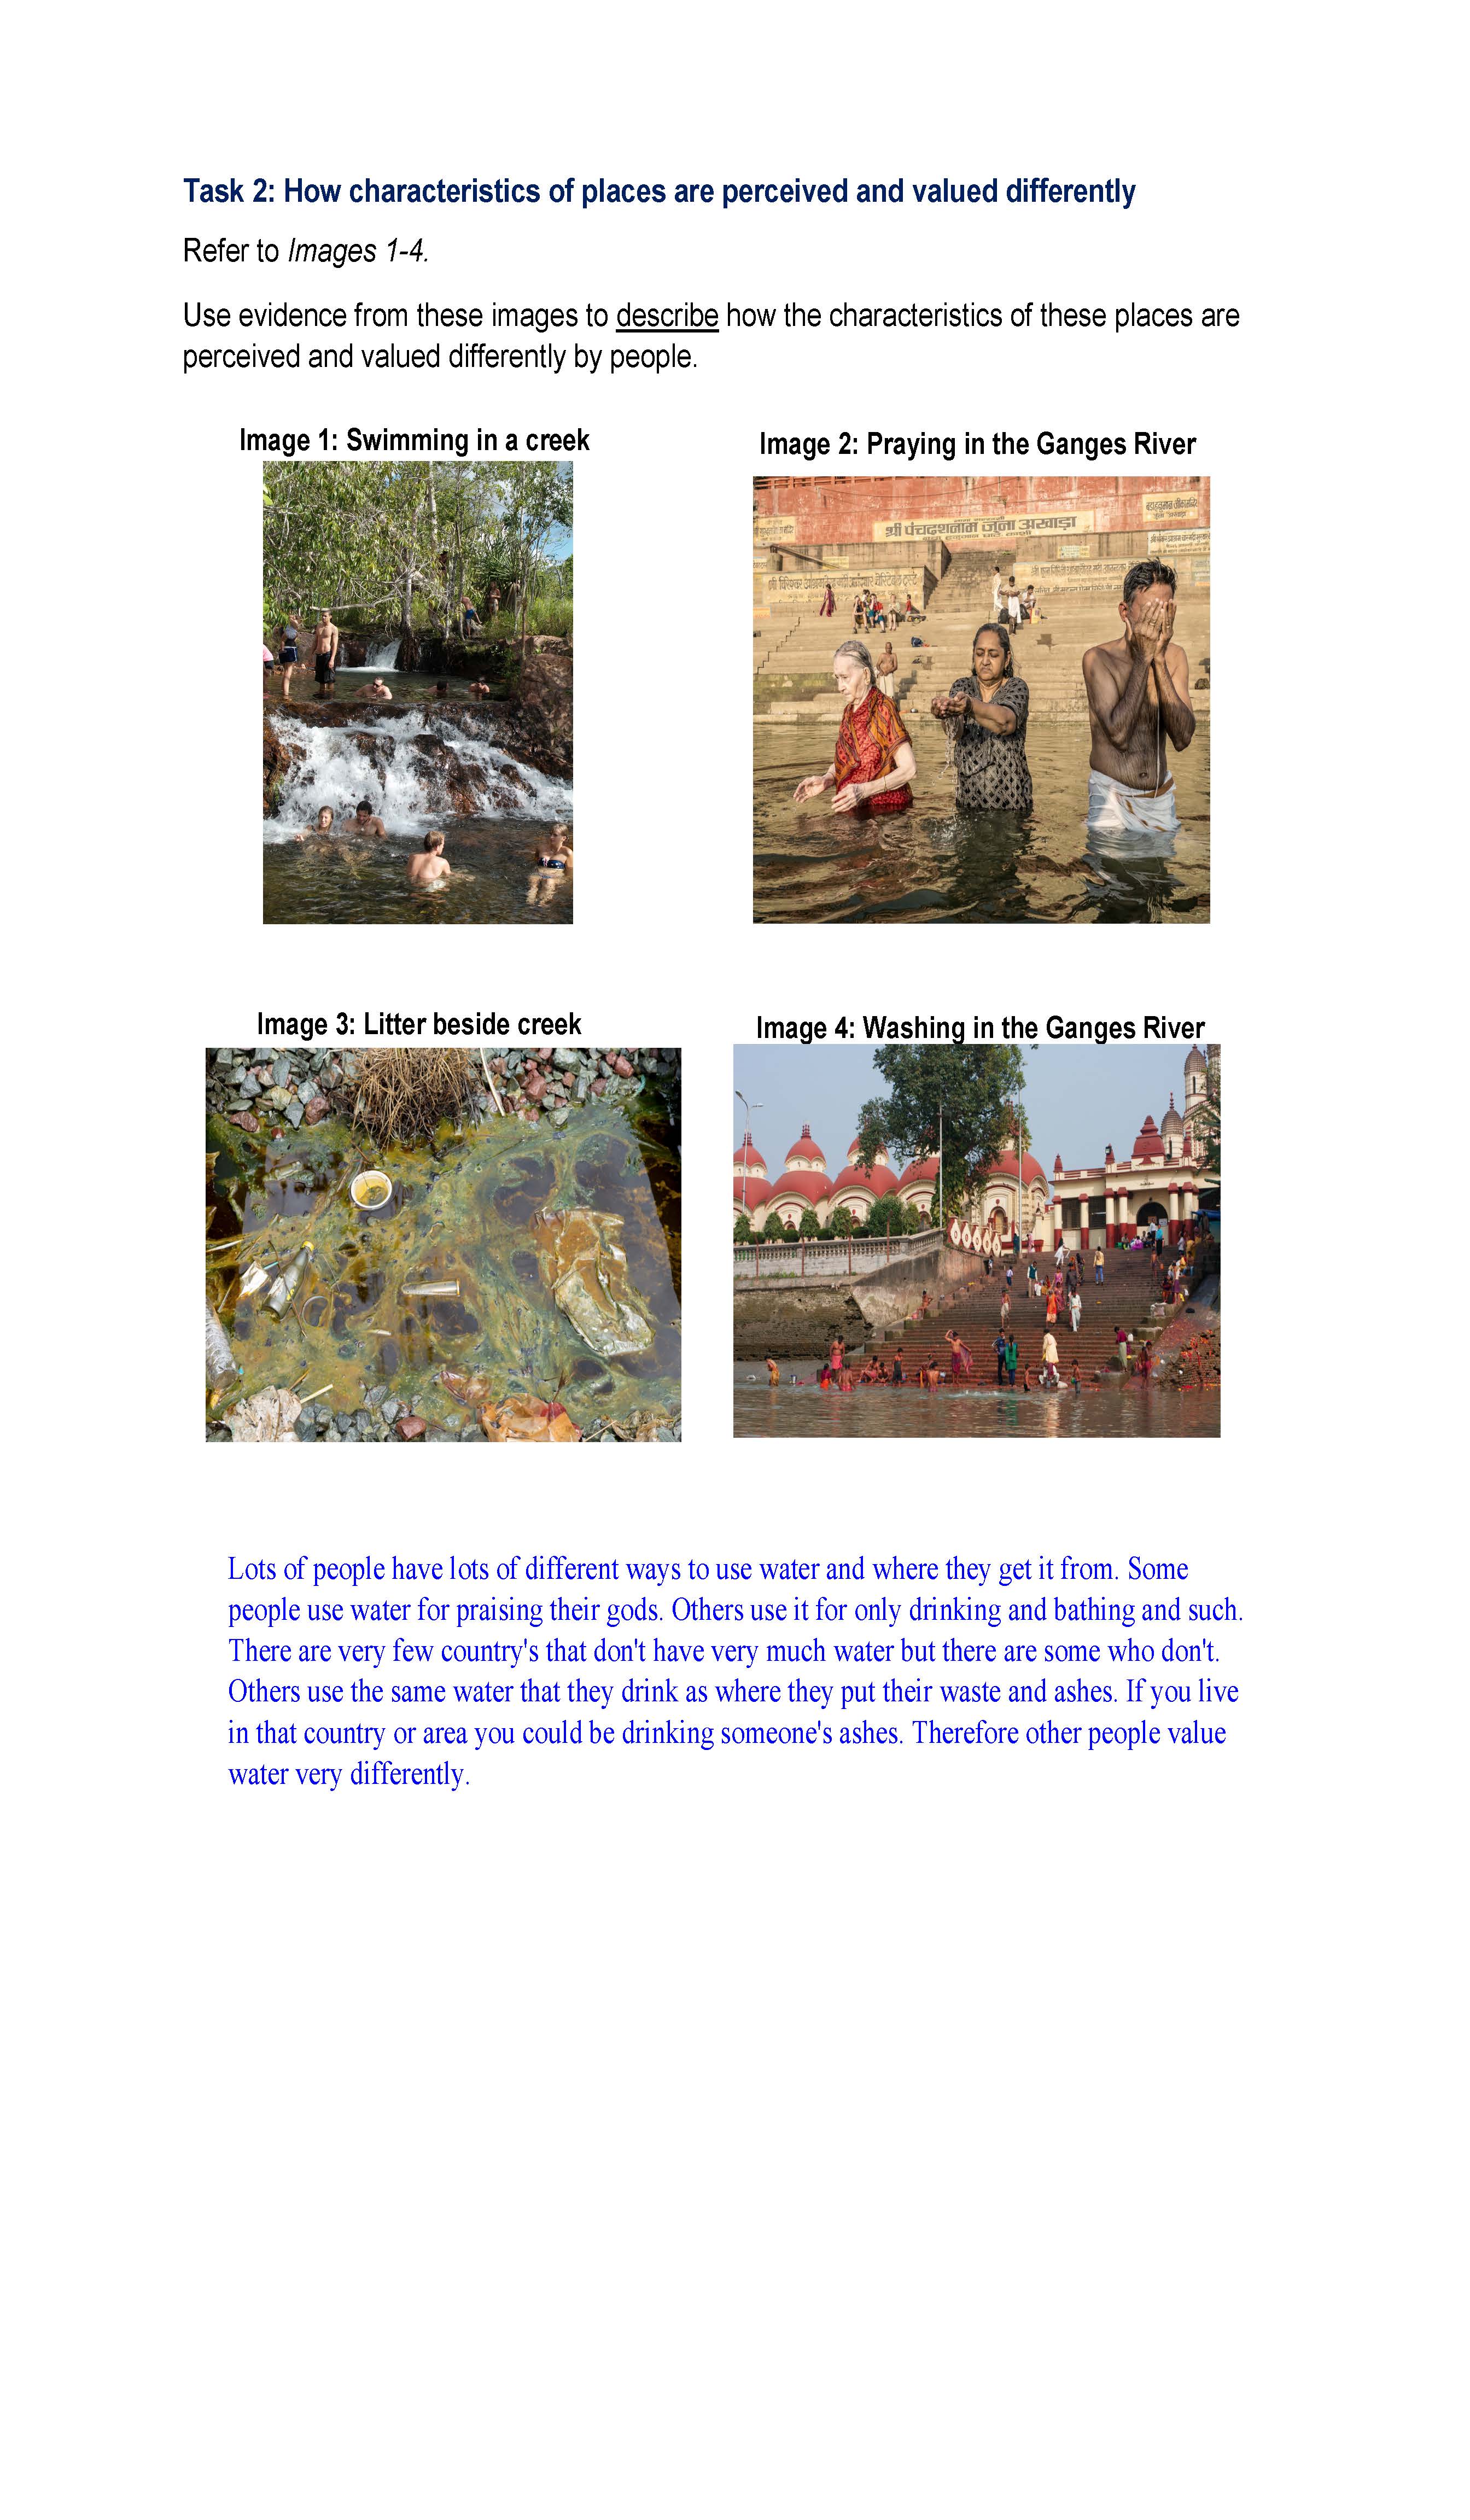
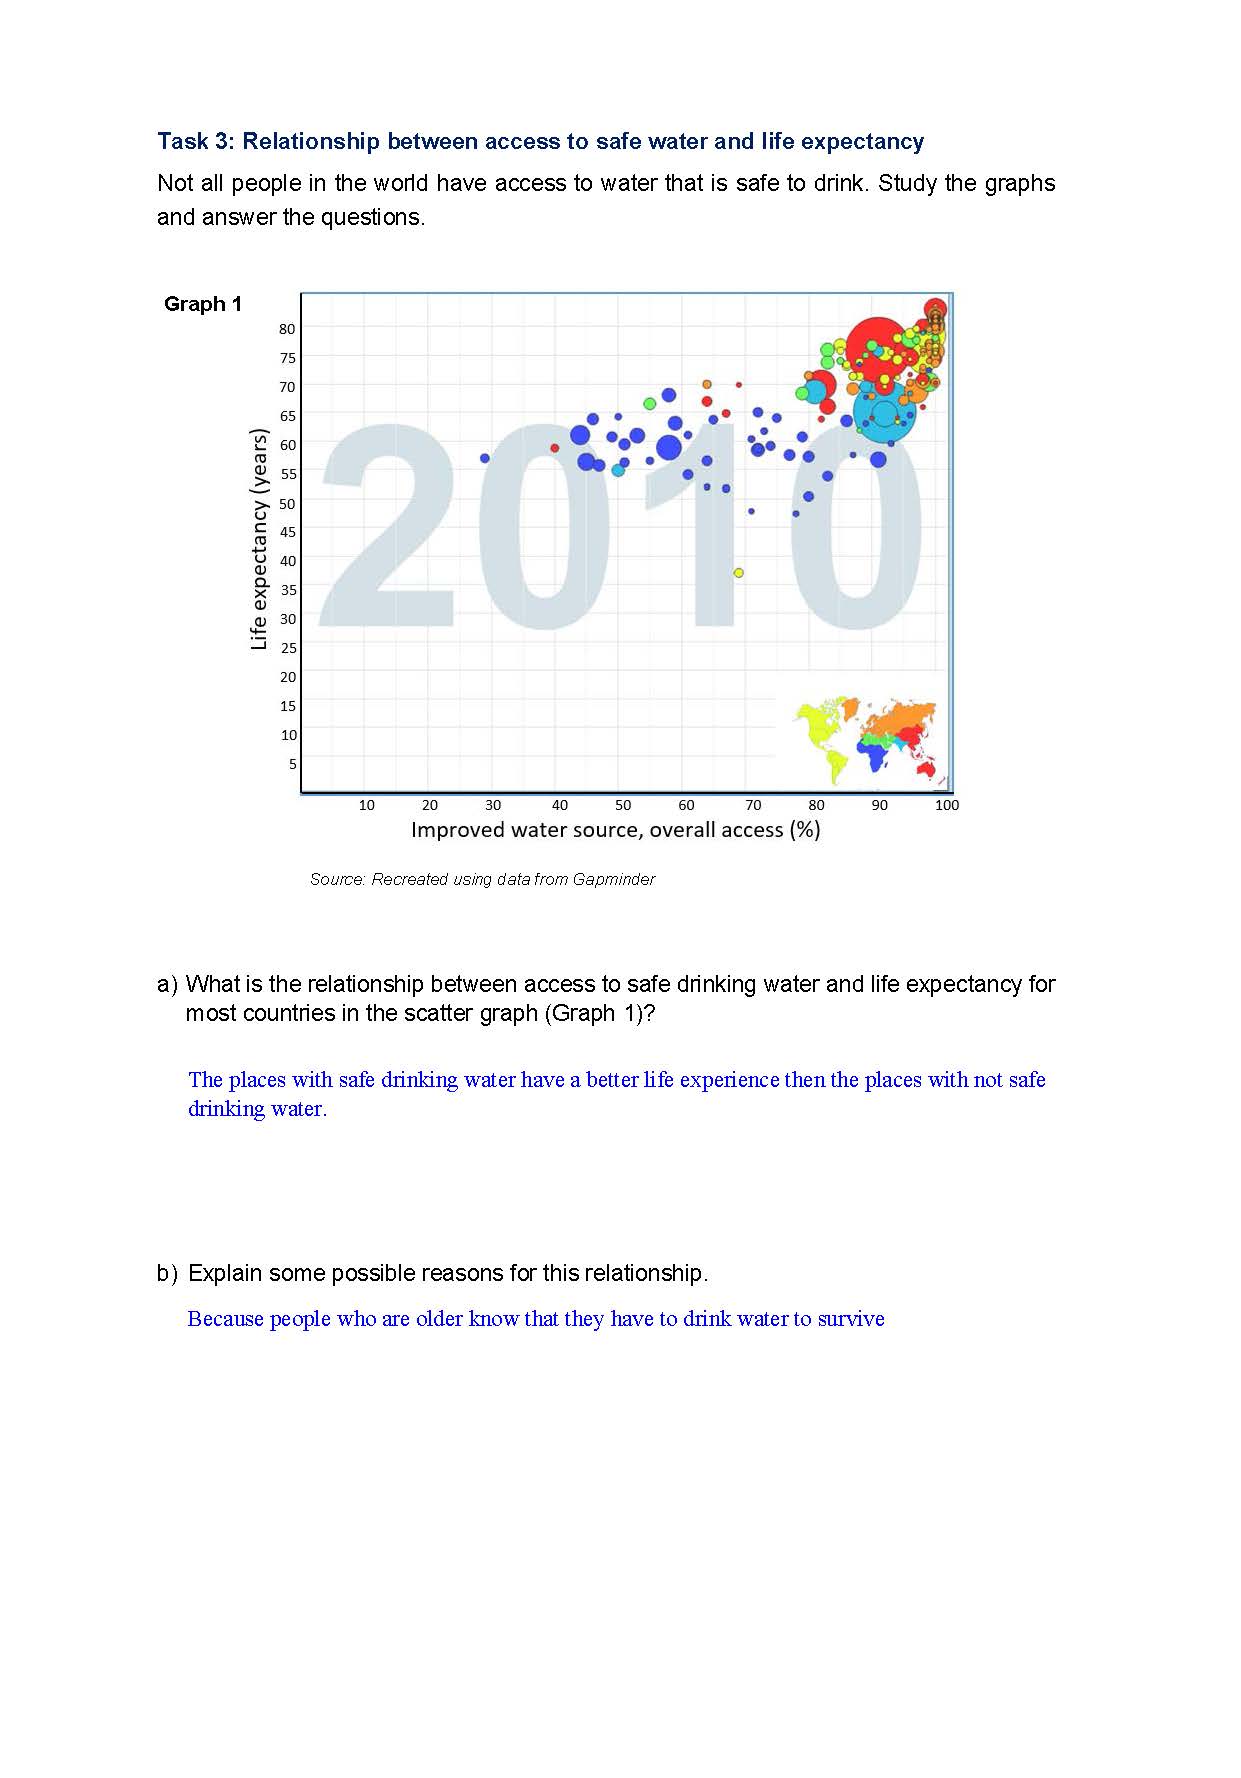
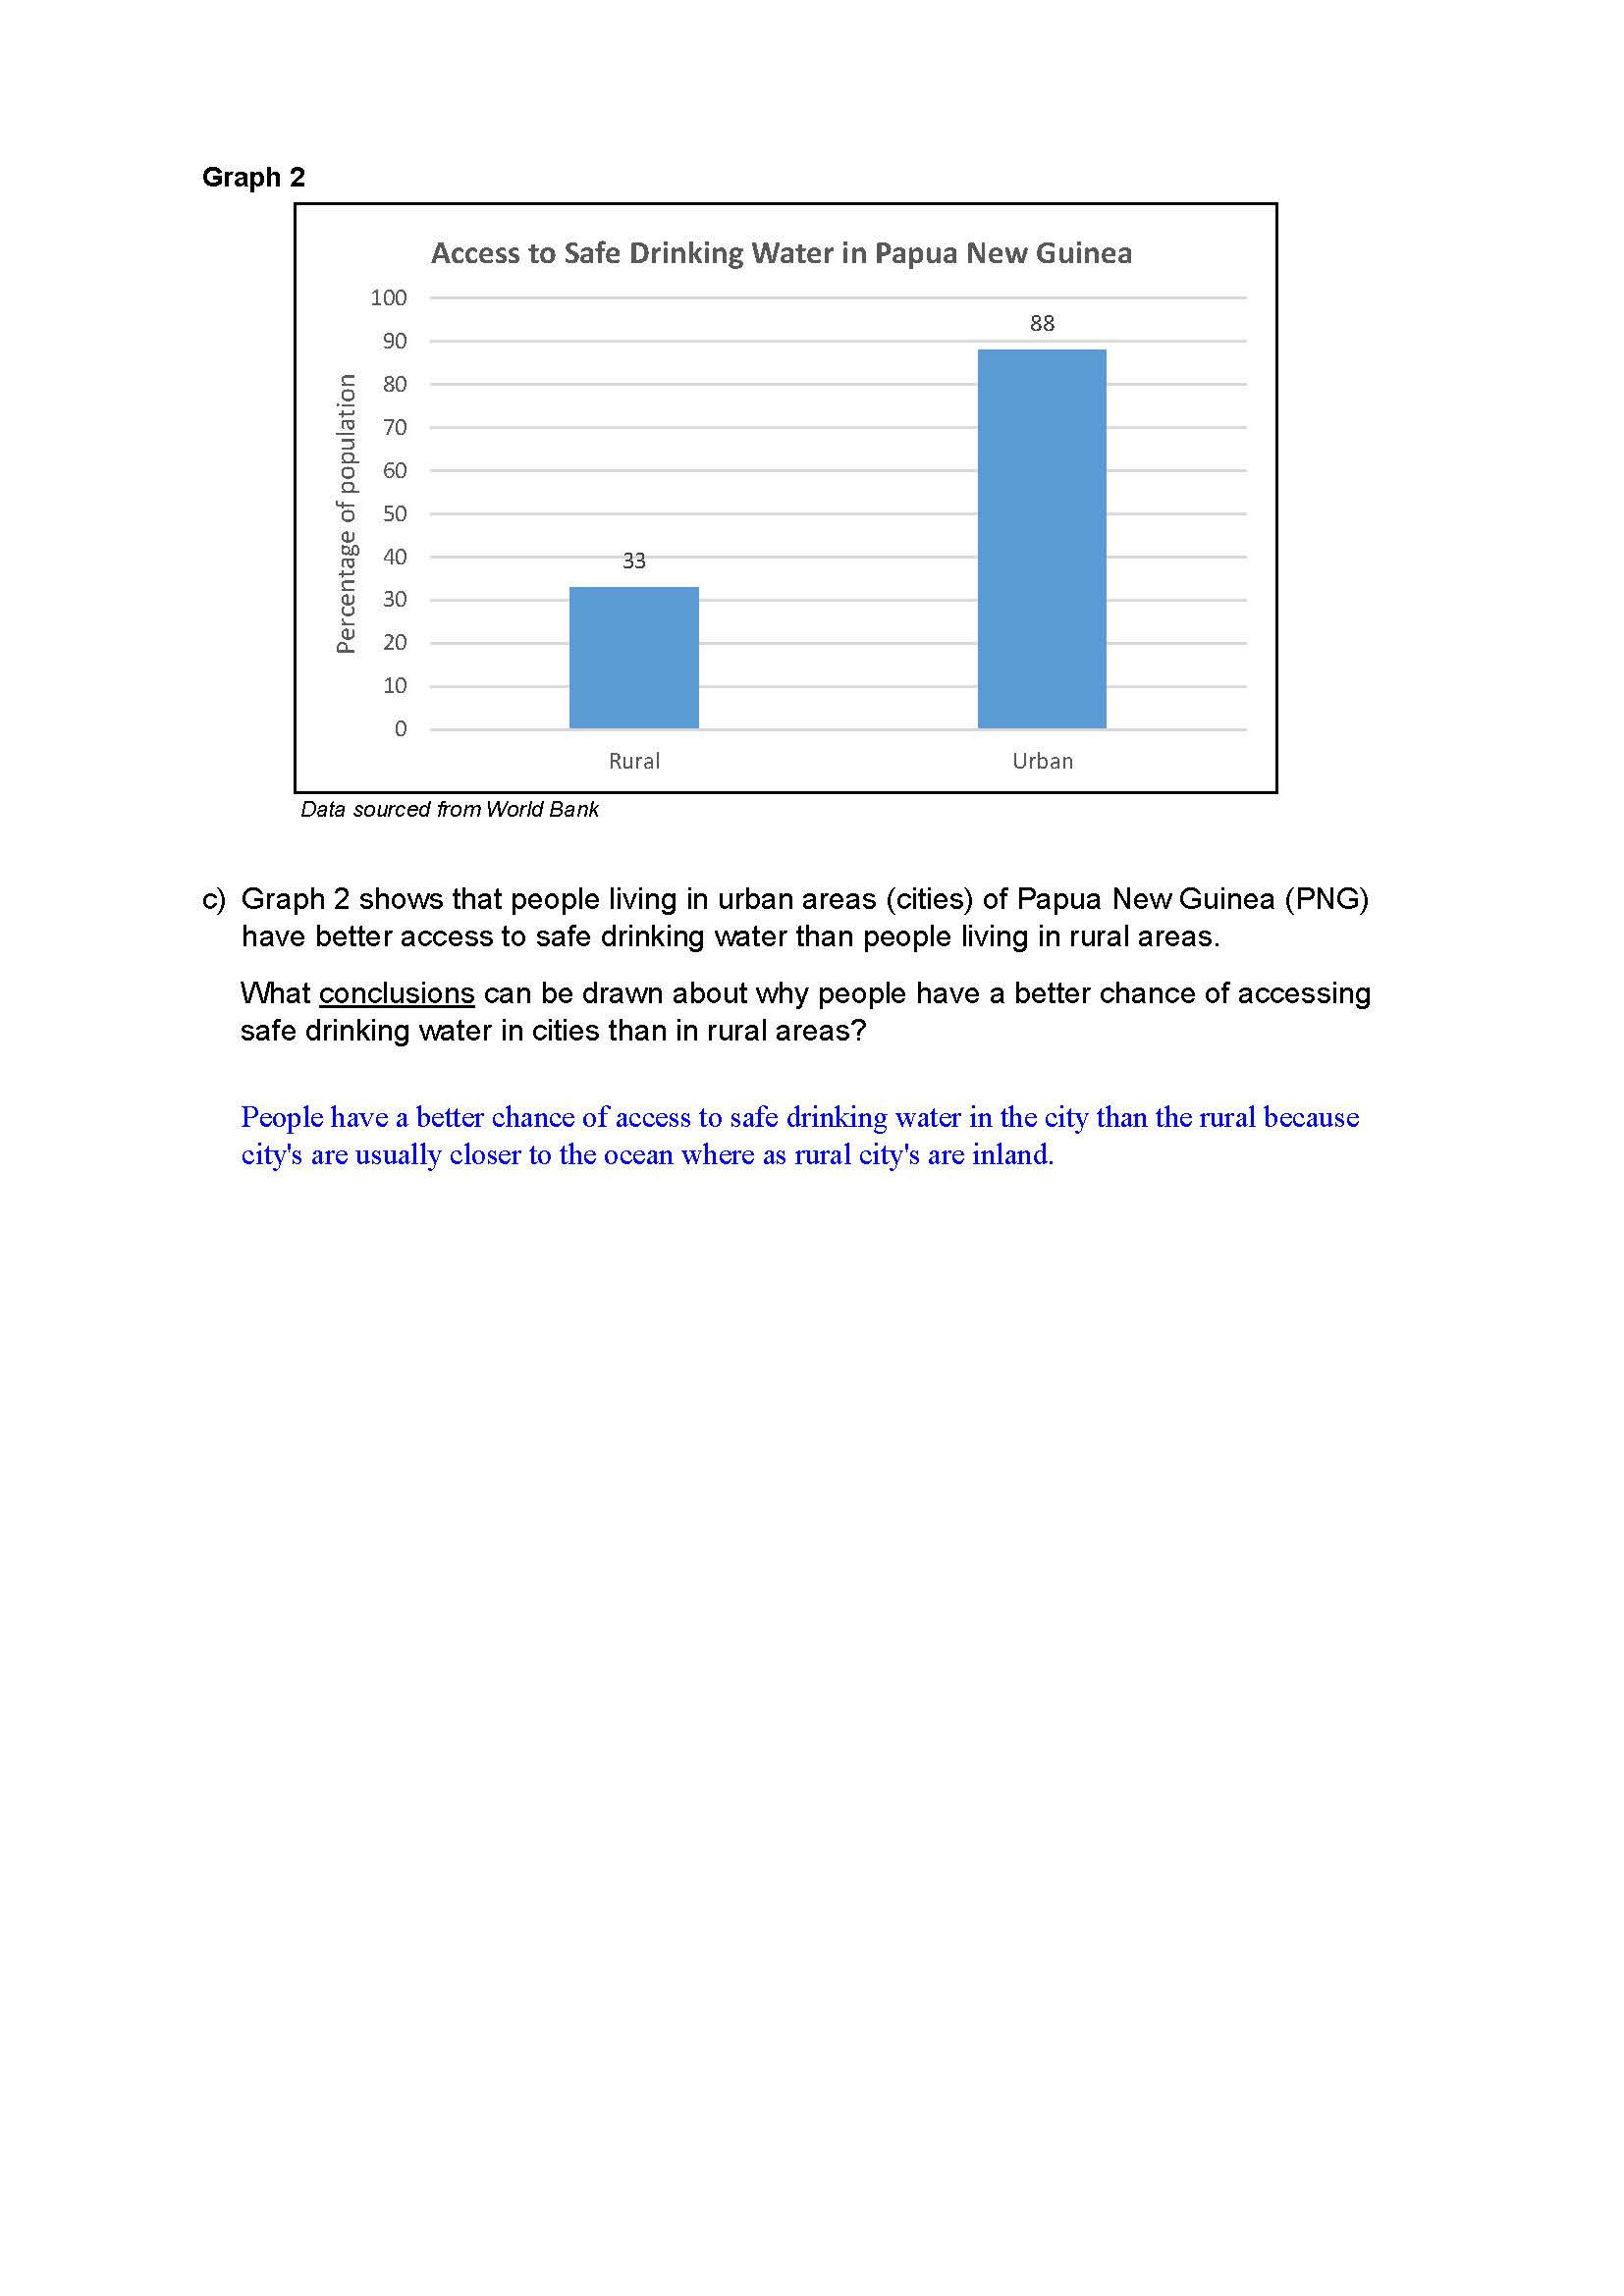
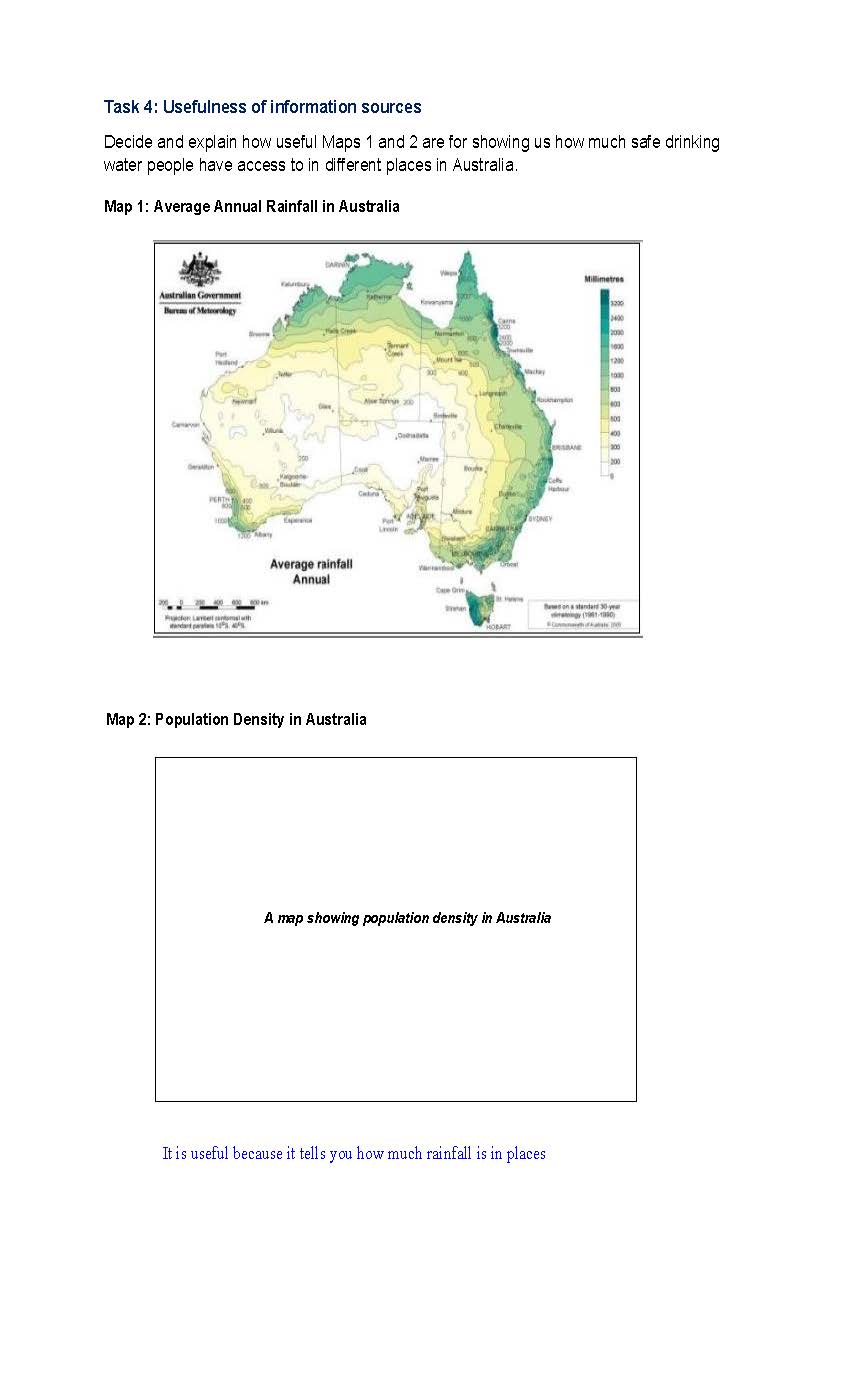
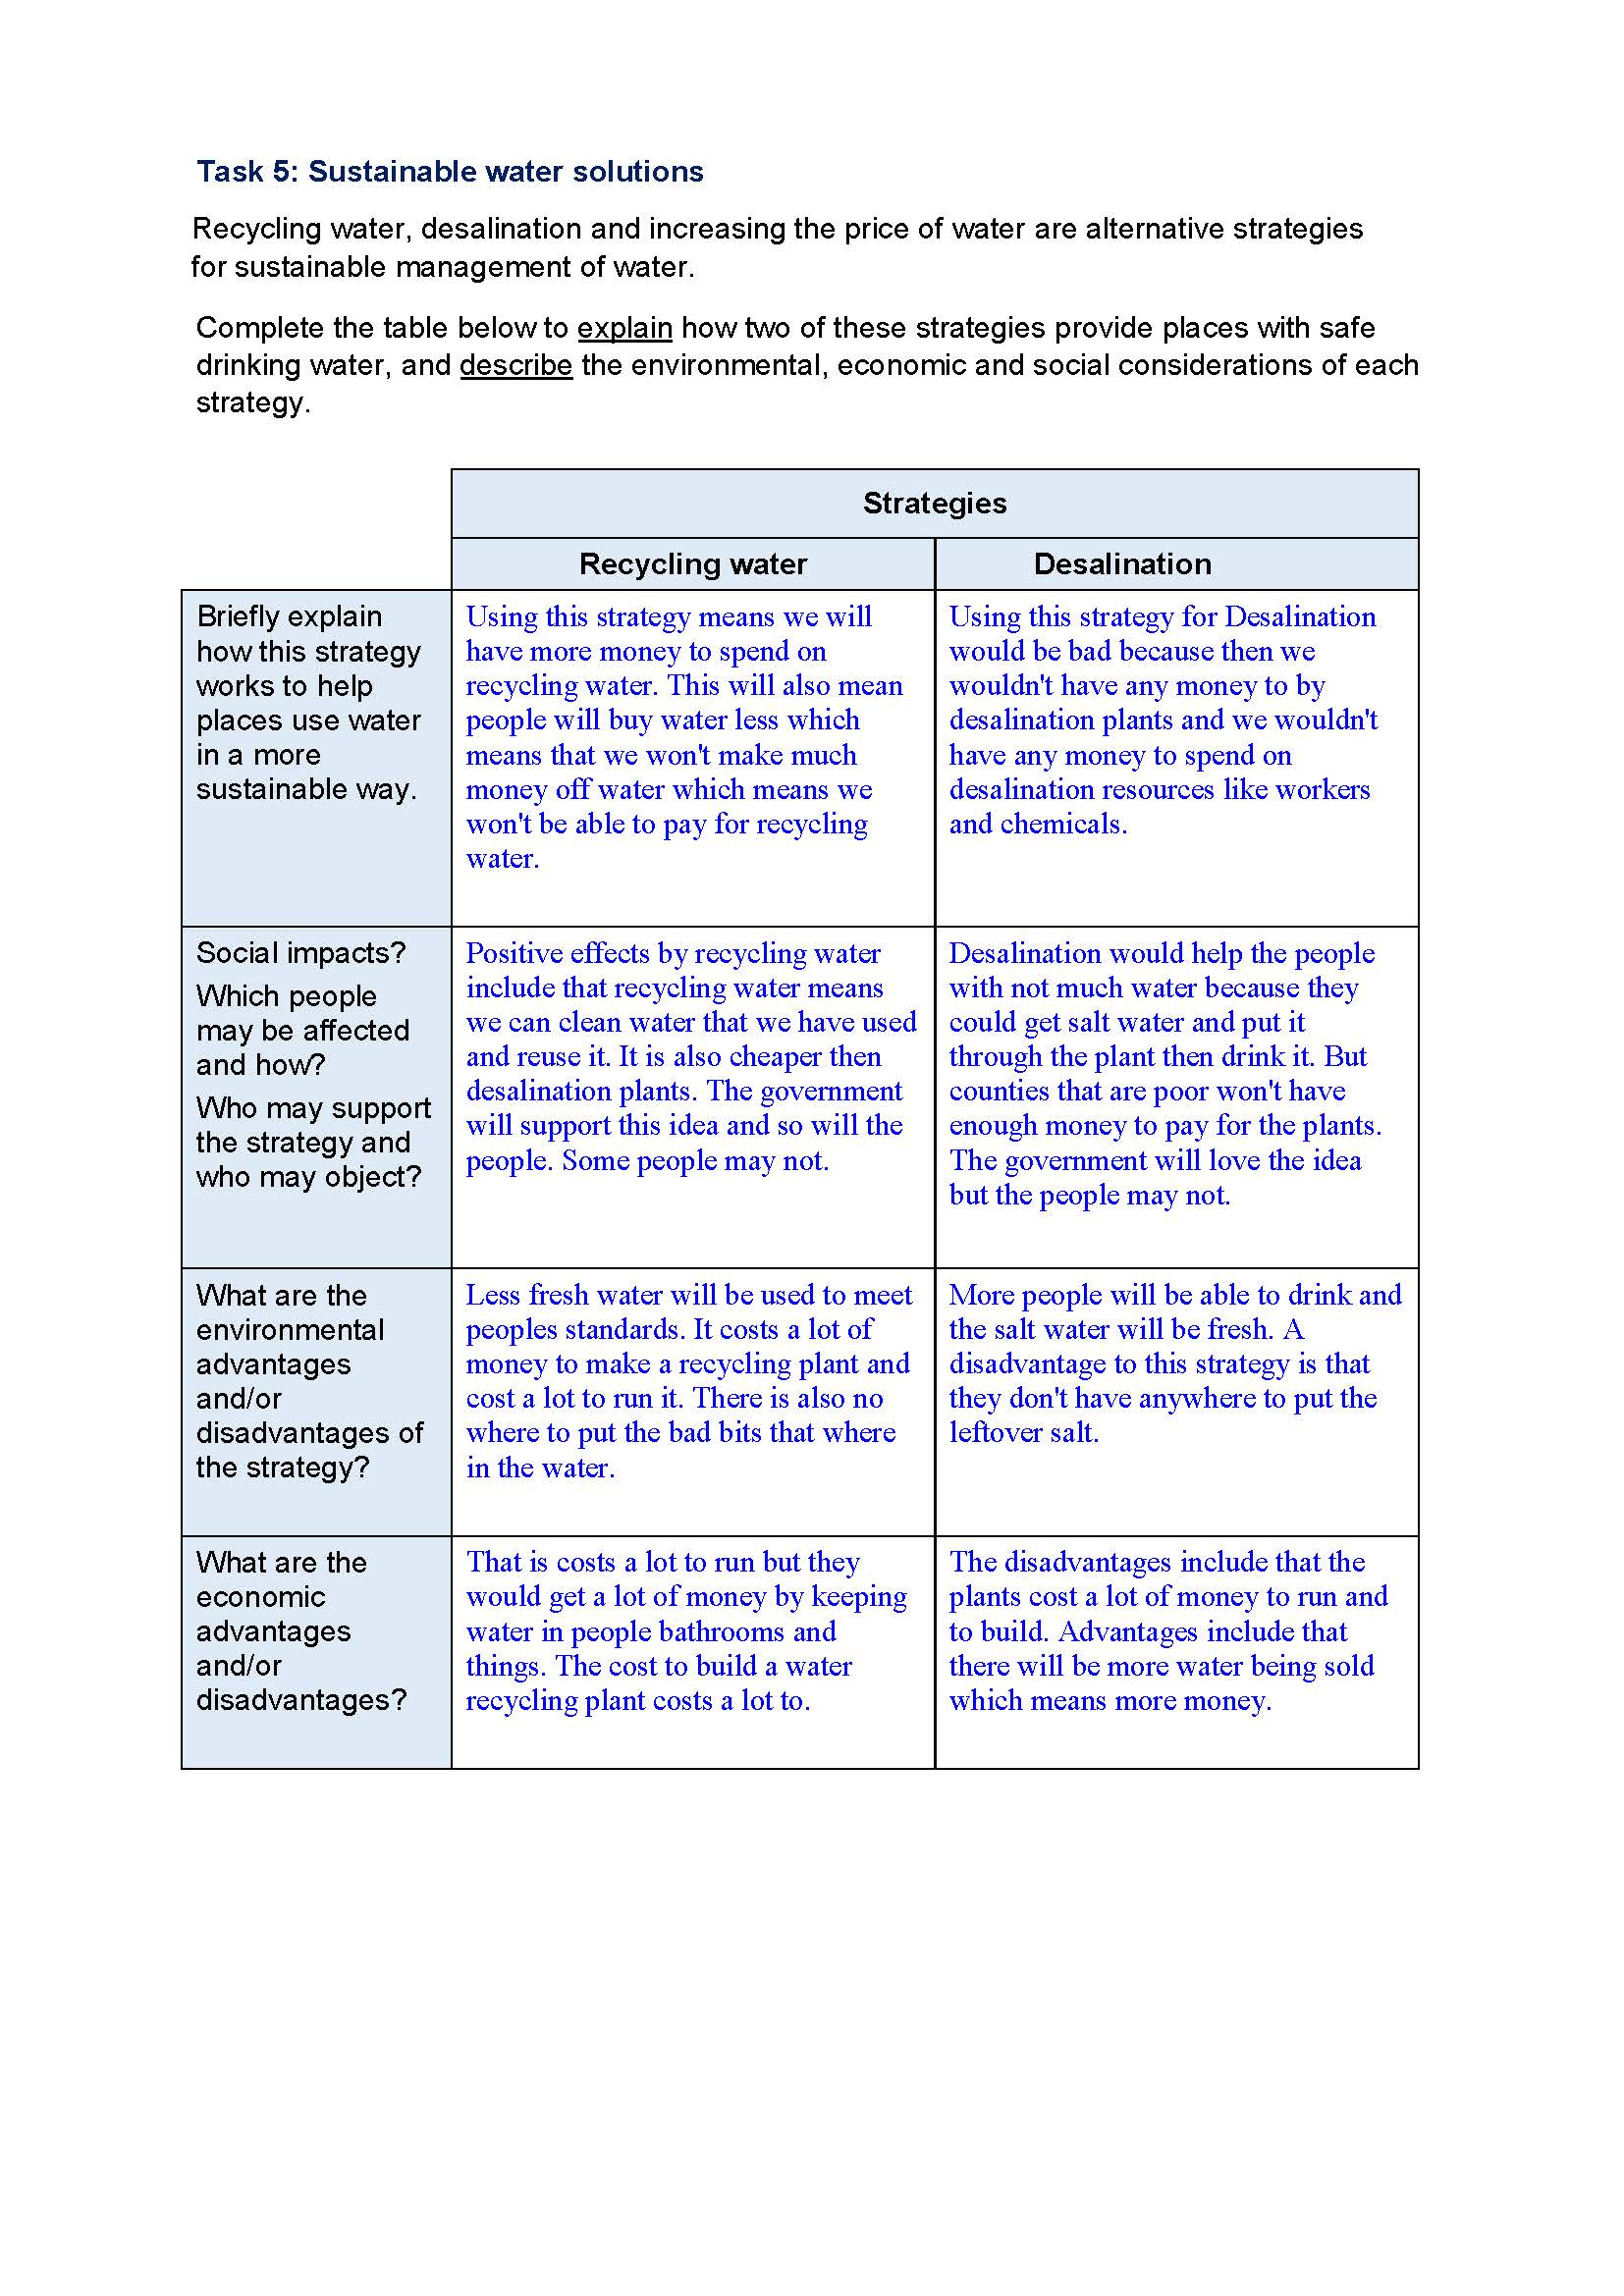
Students were provided with images, graphs and thematic world maps showing average annual precipitation and access to improved drinking water. They asked to identify global patterns of average precipitation and access to improved drinking water; describe the relationships between these patterns; and provide reasons for the identified relationships. They evaluated the usefulness of maps to understand the limitation of information, and concluded their studies by evaluating the sustainability of alternative strategies for water management.
