Satisfactory
Research assignment: Wellbeing indicators
 1
2
3
4
1
2
3
4
-
Annotations
-
1
Annotation 1
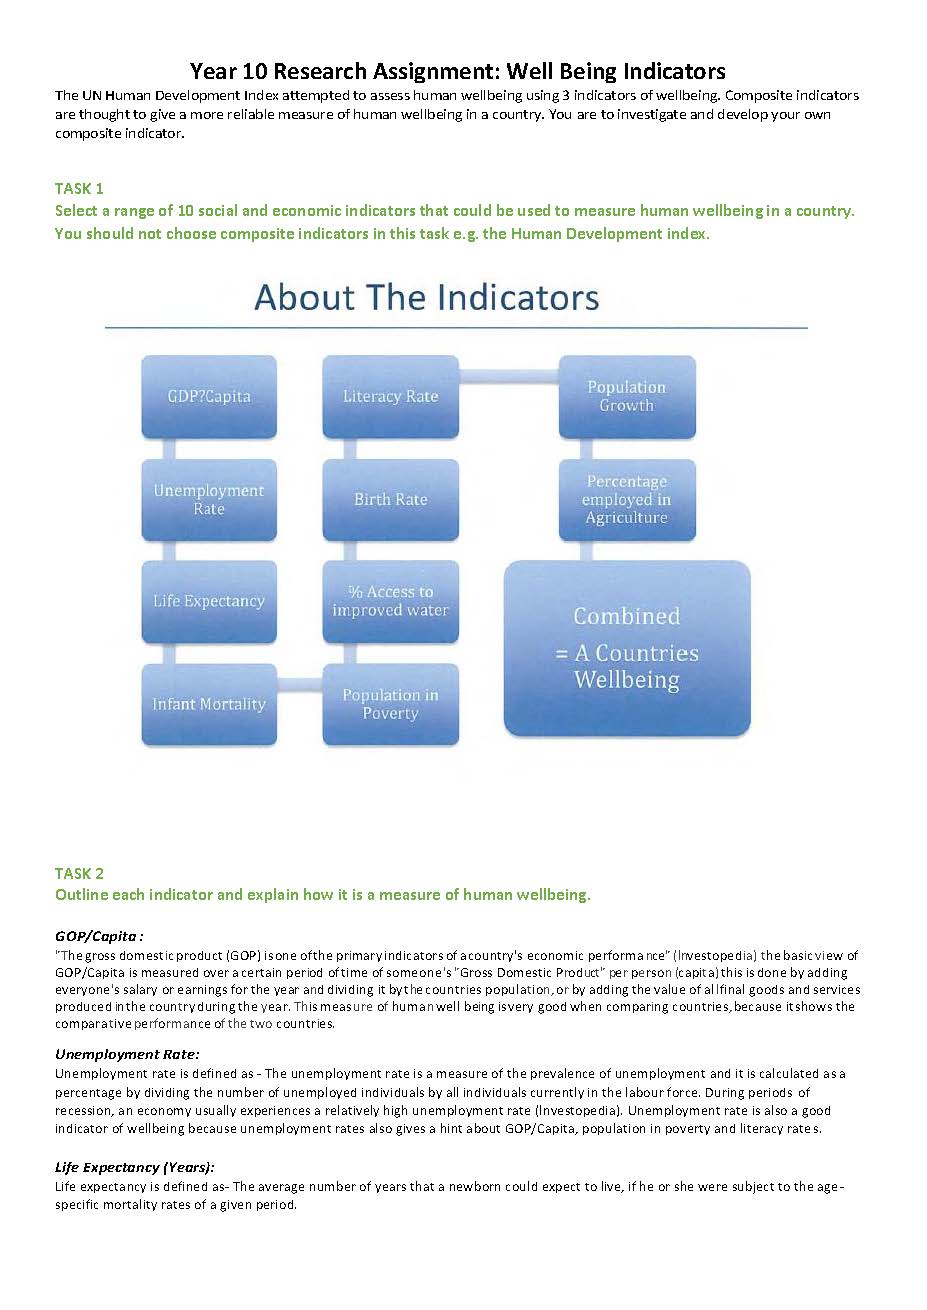
Identifies significant interconnections between people, places and environments -
2
Annotation 2
Explains some significant relationships between control of corruption and people's wellbeing -
3
Annotation 3
Explains some significant relationships between GDP and people's wellbeing -
4
Annotation 4
Explains some changes that result from these interconnections and their consequences
 1
2
3
4
5
6
7
8
9
10
1
2
3
4
5
6
7
8
9
10
-
Annotations
-
1
Annotation 1
Explains the relationship between schooling and people's wellbeing -
2
Annotation 2
Explains the relationship between sanitation and people's wellbeing -
3
Annotation 3
Explains the relationship between child mortality and people's wellbeing -
4
Annotation 4
Explains the relationship between agricultural employment and people's wellbeing -
5
Annotation 5
Explains the relationship between life expectancy and people's wellbeing -
6
Annotation 6
Explains the relationship between gender, education and people's wellbeing -
7
Annotation 7
Explains the relationship between national account balance and people's wellbeing -
8
Annotation 8
Explains the relationship between internet access and people's wellbeing -
9
Annotation 9
Explains some changes that result from these interconnections and their consequence -
10
Annotation 10
Uses relevant geographical terminology
 1
1
-
Annotations
-
1
Annotation 1
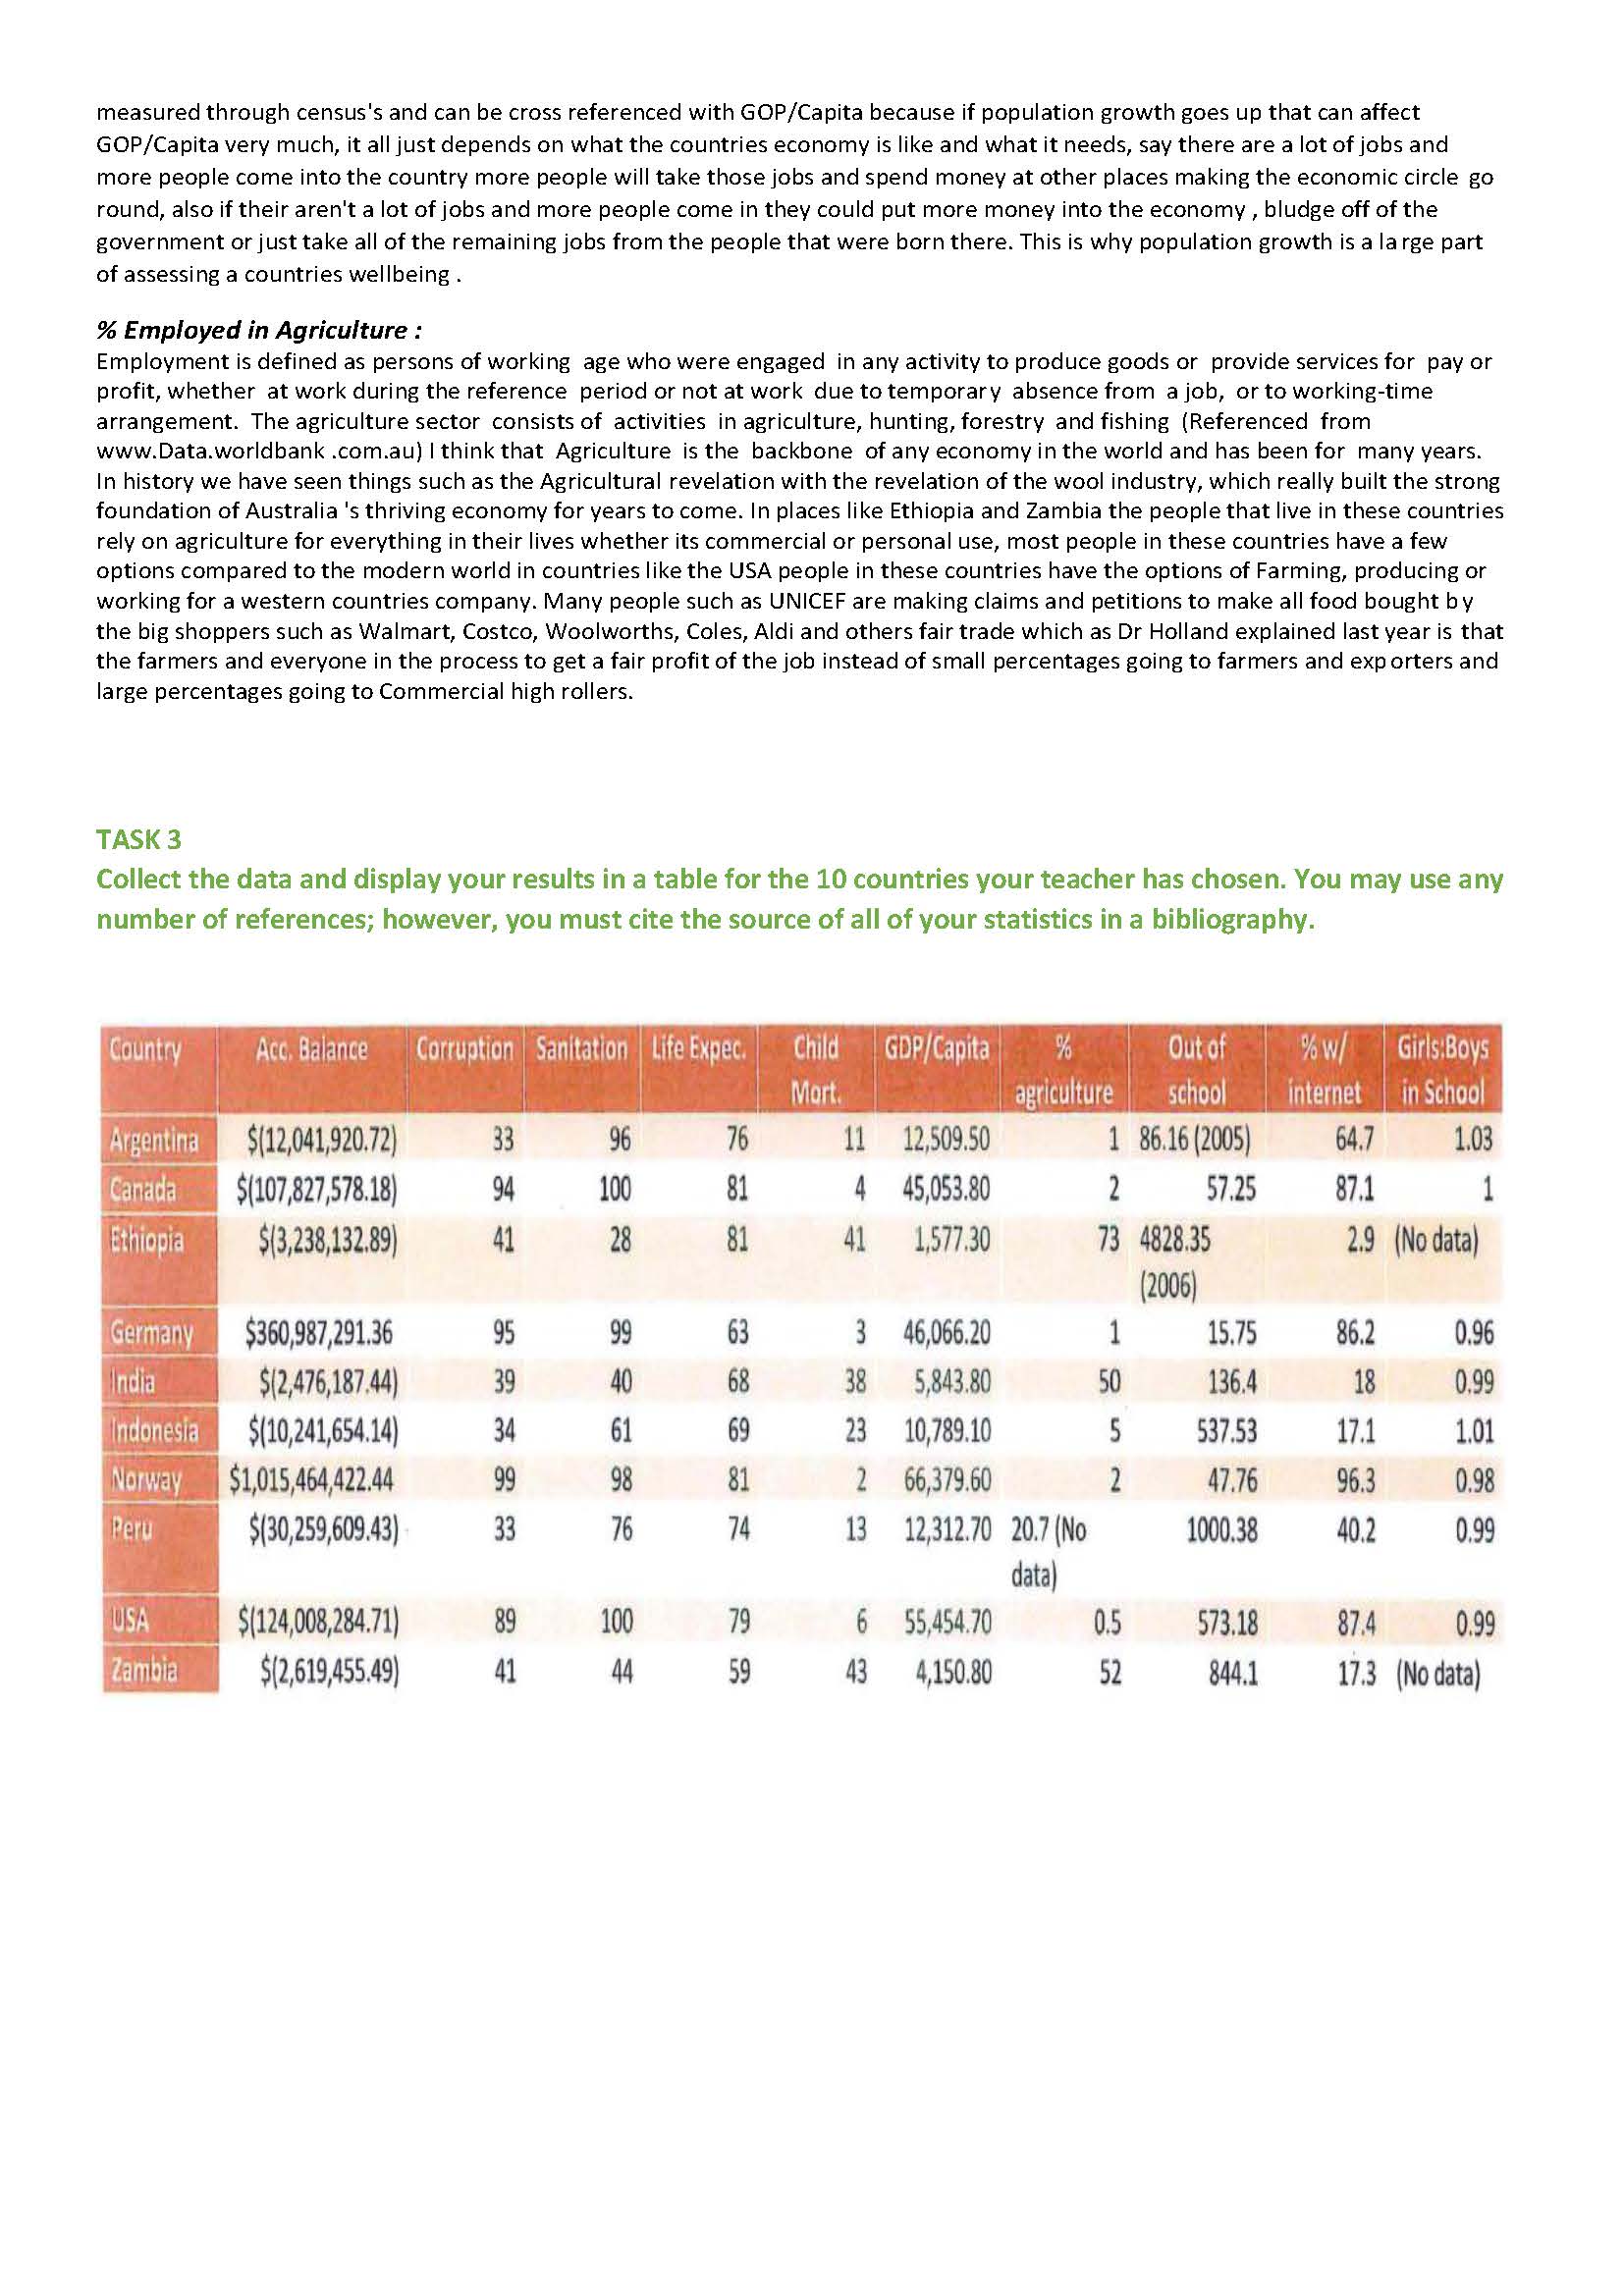
Records data in an appropriate format
 1
2
3
1
2
3
-
Annotations
-
1
Annotation 1
Analyses and synthesises data to draw relevant conclusions -
2
Annotation 2
Uses relevant geographical terminology -
3
Annotation 3
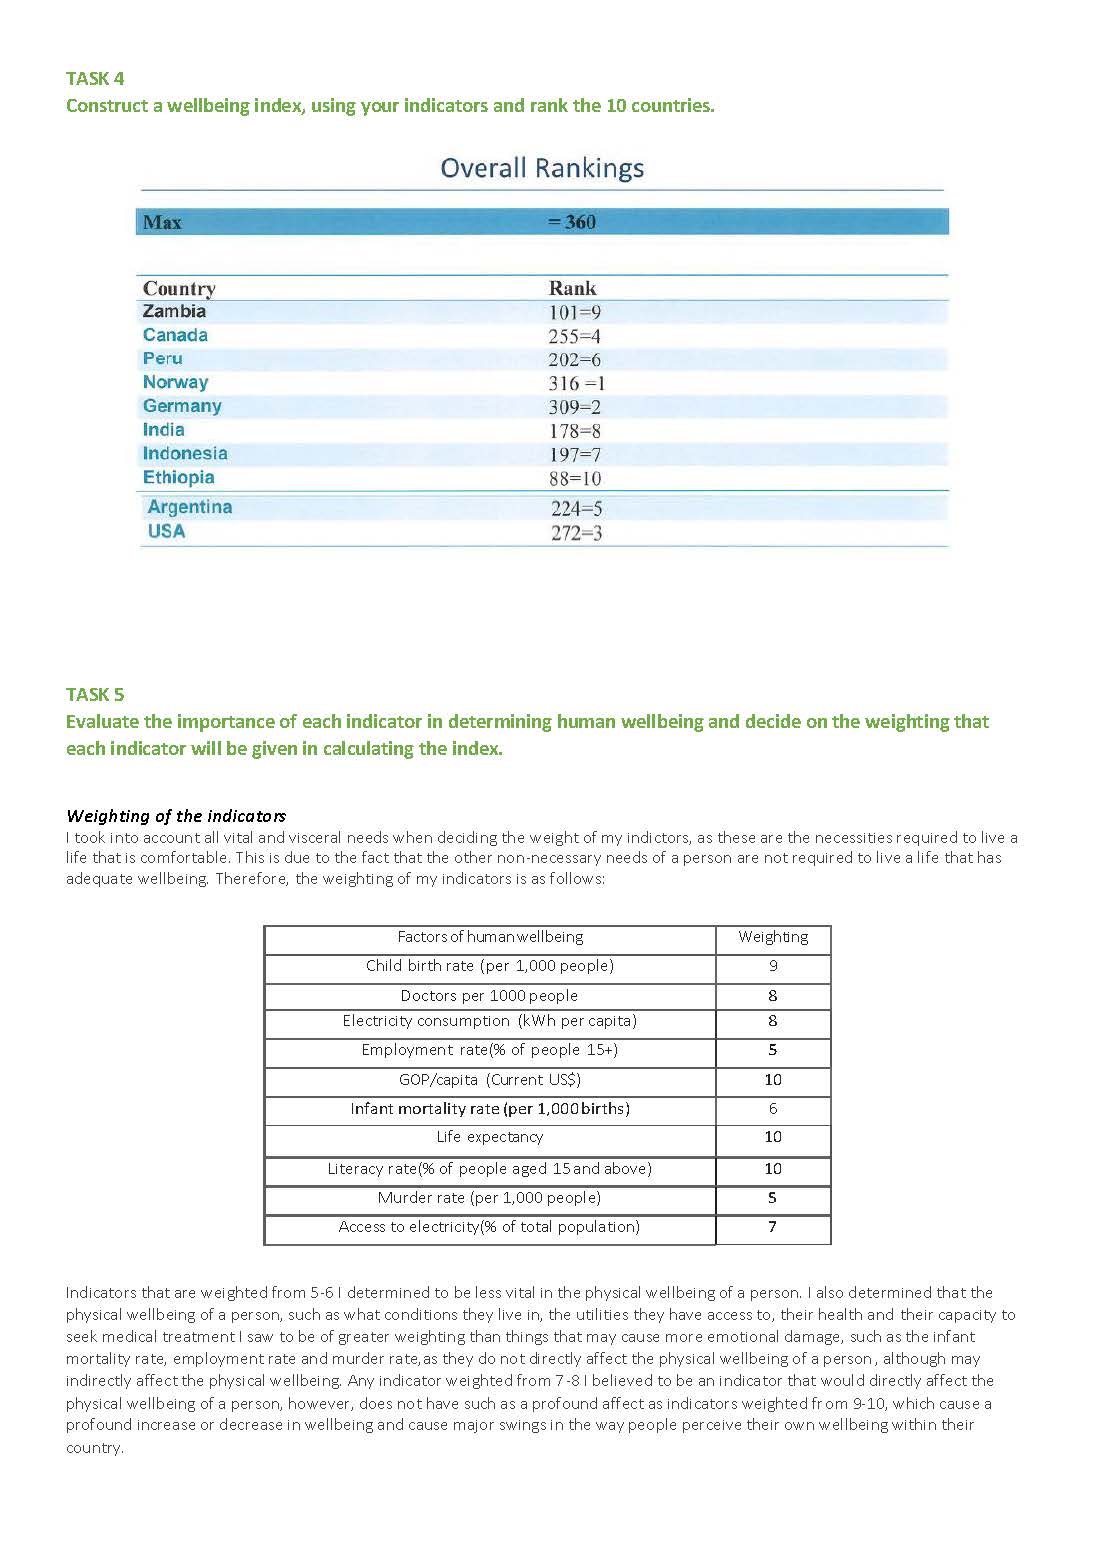
Constructs a wellbeing index that ranks countries
 1
2
3
1
2
3
-
Annotations
-
1
Annotation 1
Indicates the processes used to interpret and analyse data -
2
Annotation 2
Provides some specific examples to support the judgement being presented -
3
Annotation 3
Clarifies information and analyses the implications for the indicators
 1
2
3
4
5
6
7
1
2
3
4
5
6
7
-
Annotations
-
1
Annotation 1
Provides some specific examples to support the judgement being presented -
2
Annotation 2
Clarifies information and analyses the implications for the indicator -
3
Annotation 3
Uses relevant geographical terminology -
4
Annotation 4
States the reliability of the chosen data -
5
Annotation 5
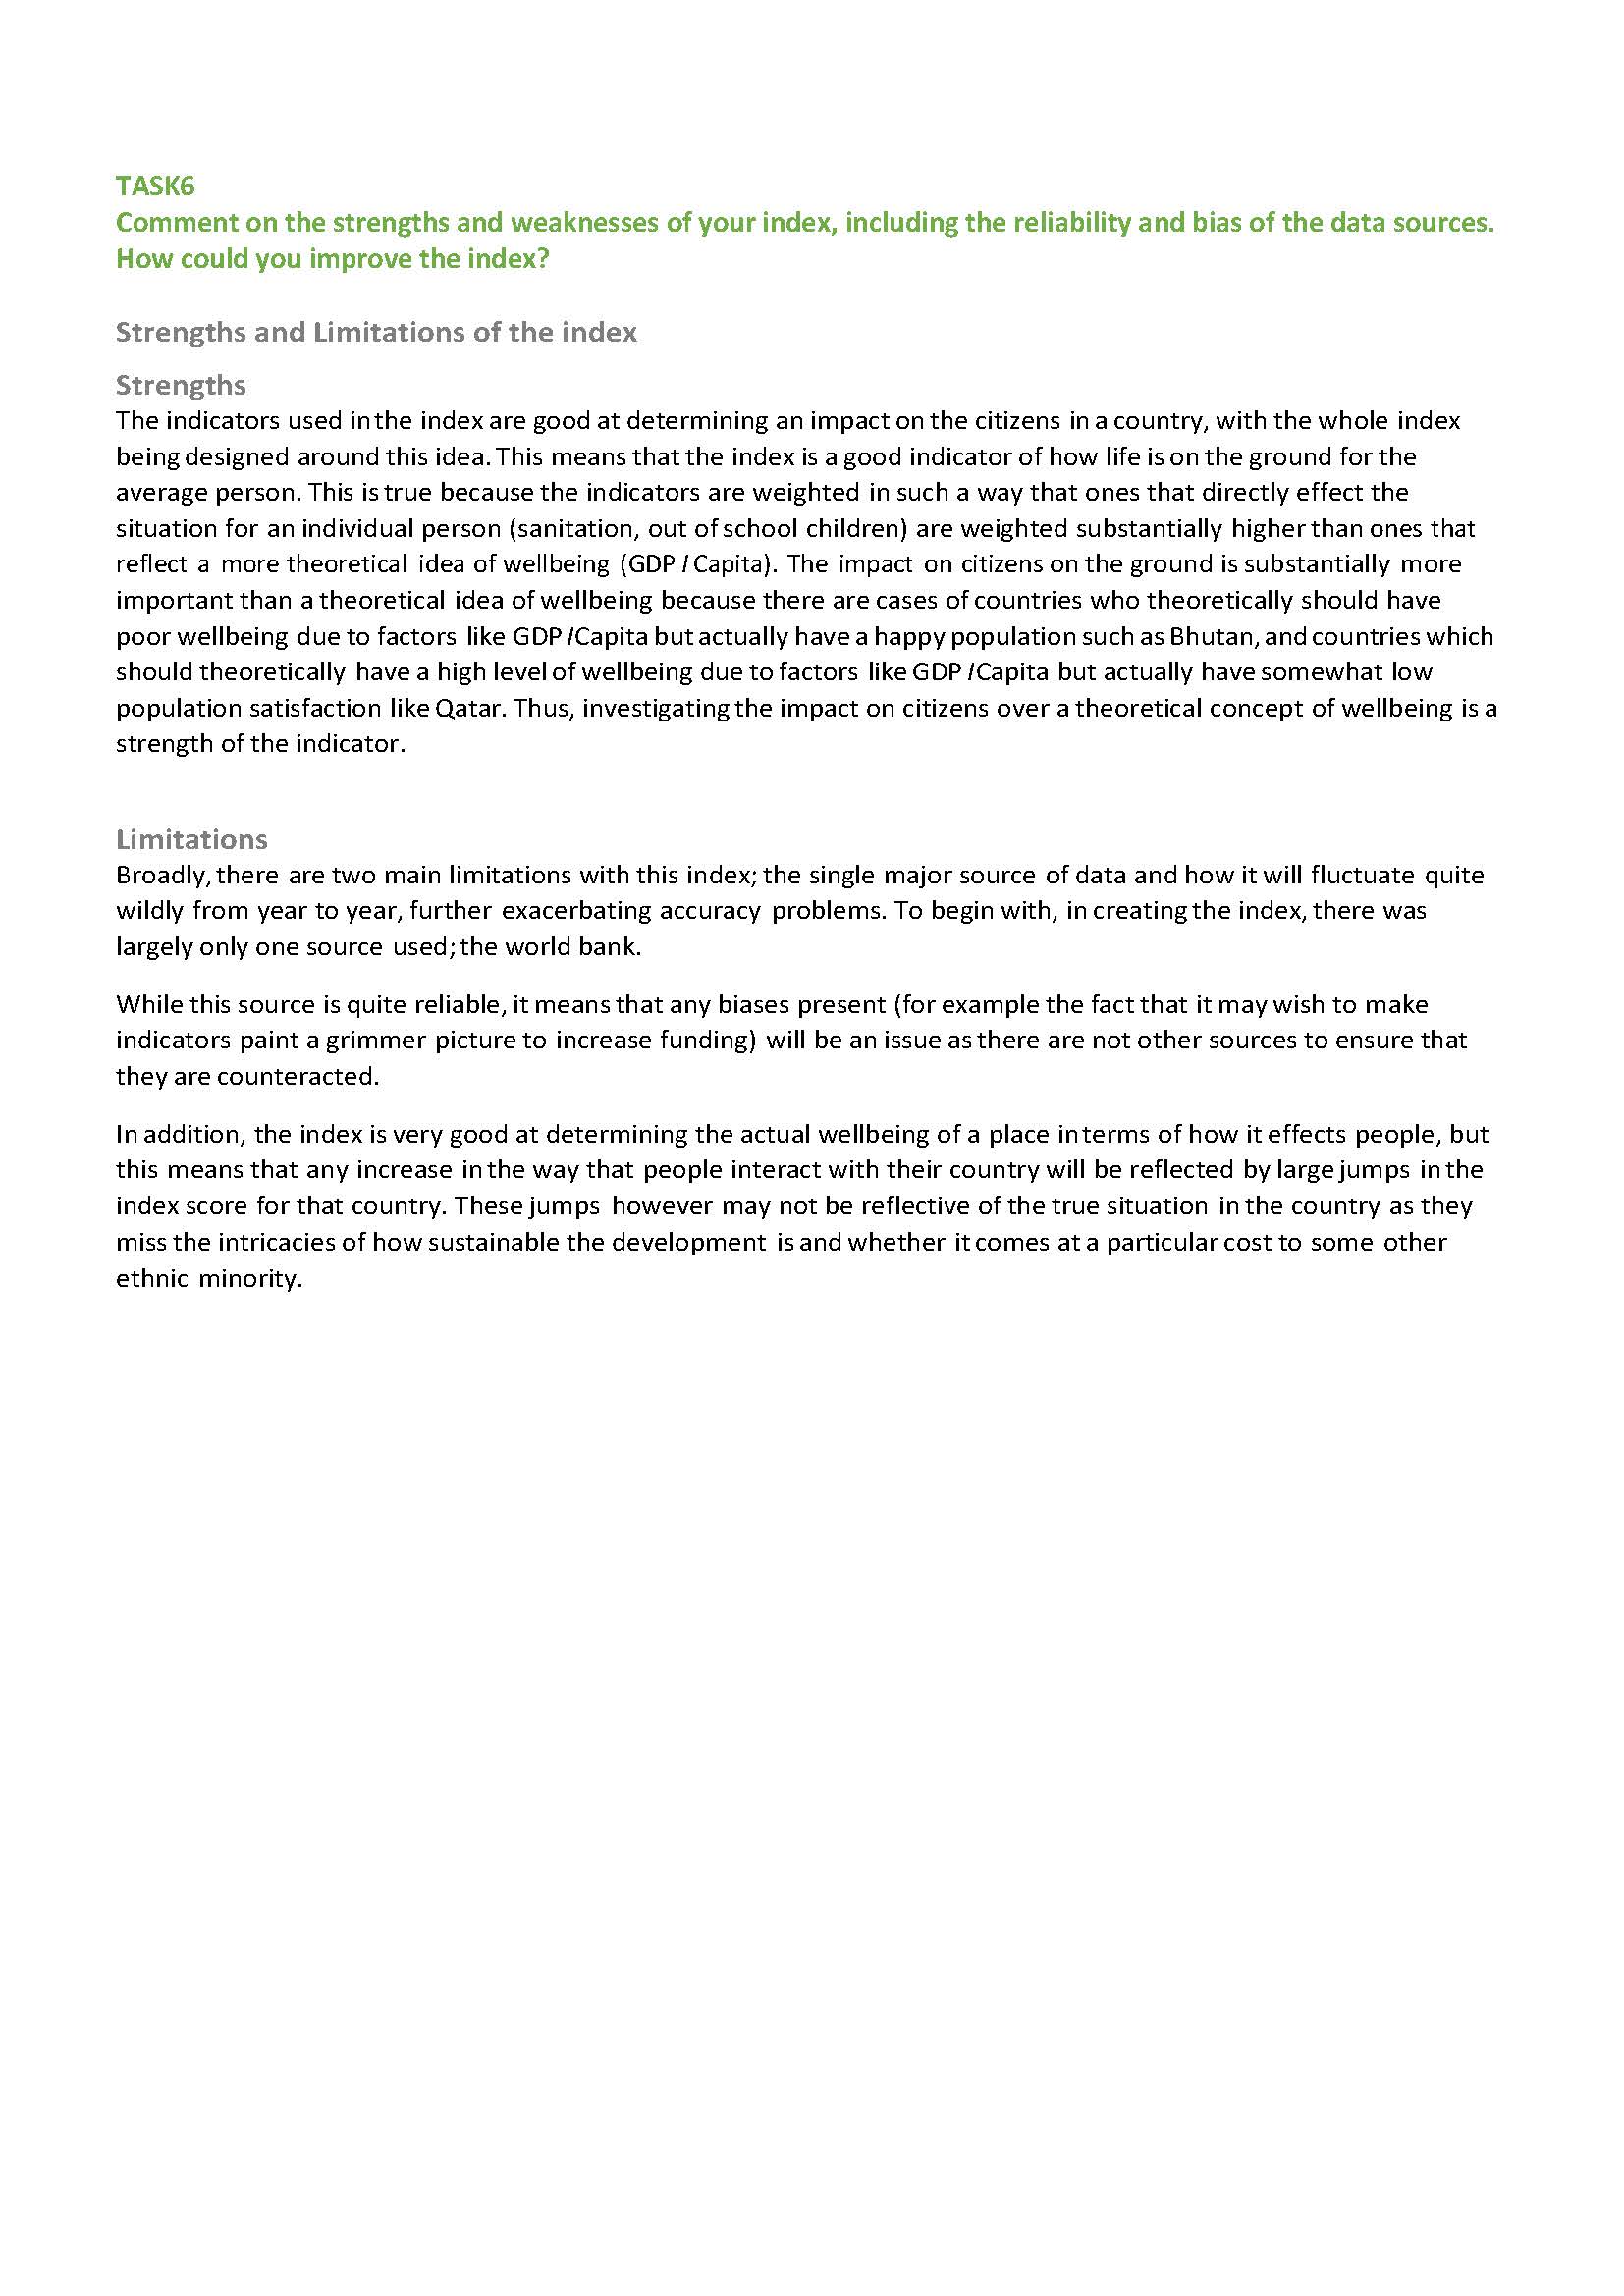
Identifies the strengths and weaknesses of the findings -
6
Annotation 6
Makes connections between the specific data sources and the effectiveness of the index -
7
Annotation 7
Presents more than one area for improvement and presents the specific reasons for making these changes
 1
2
3
1
2
3
-
Annotations
-
1
Annotation 1
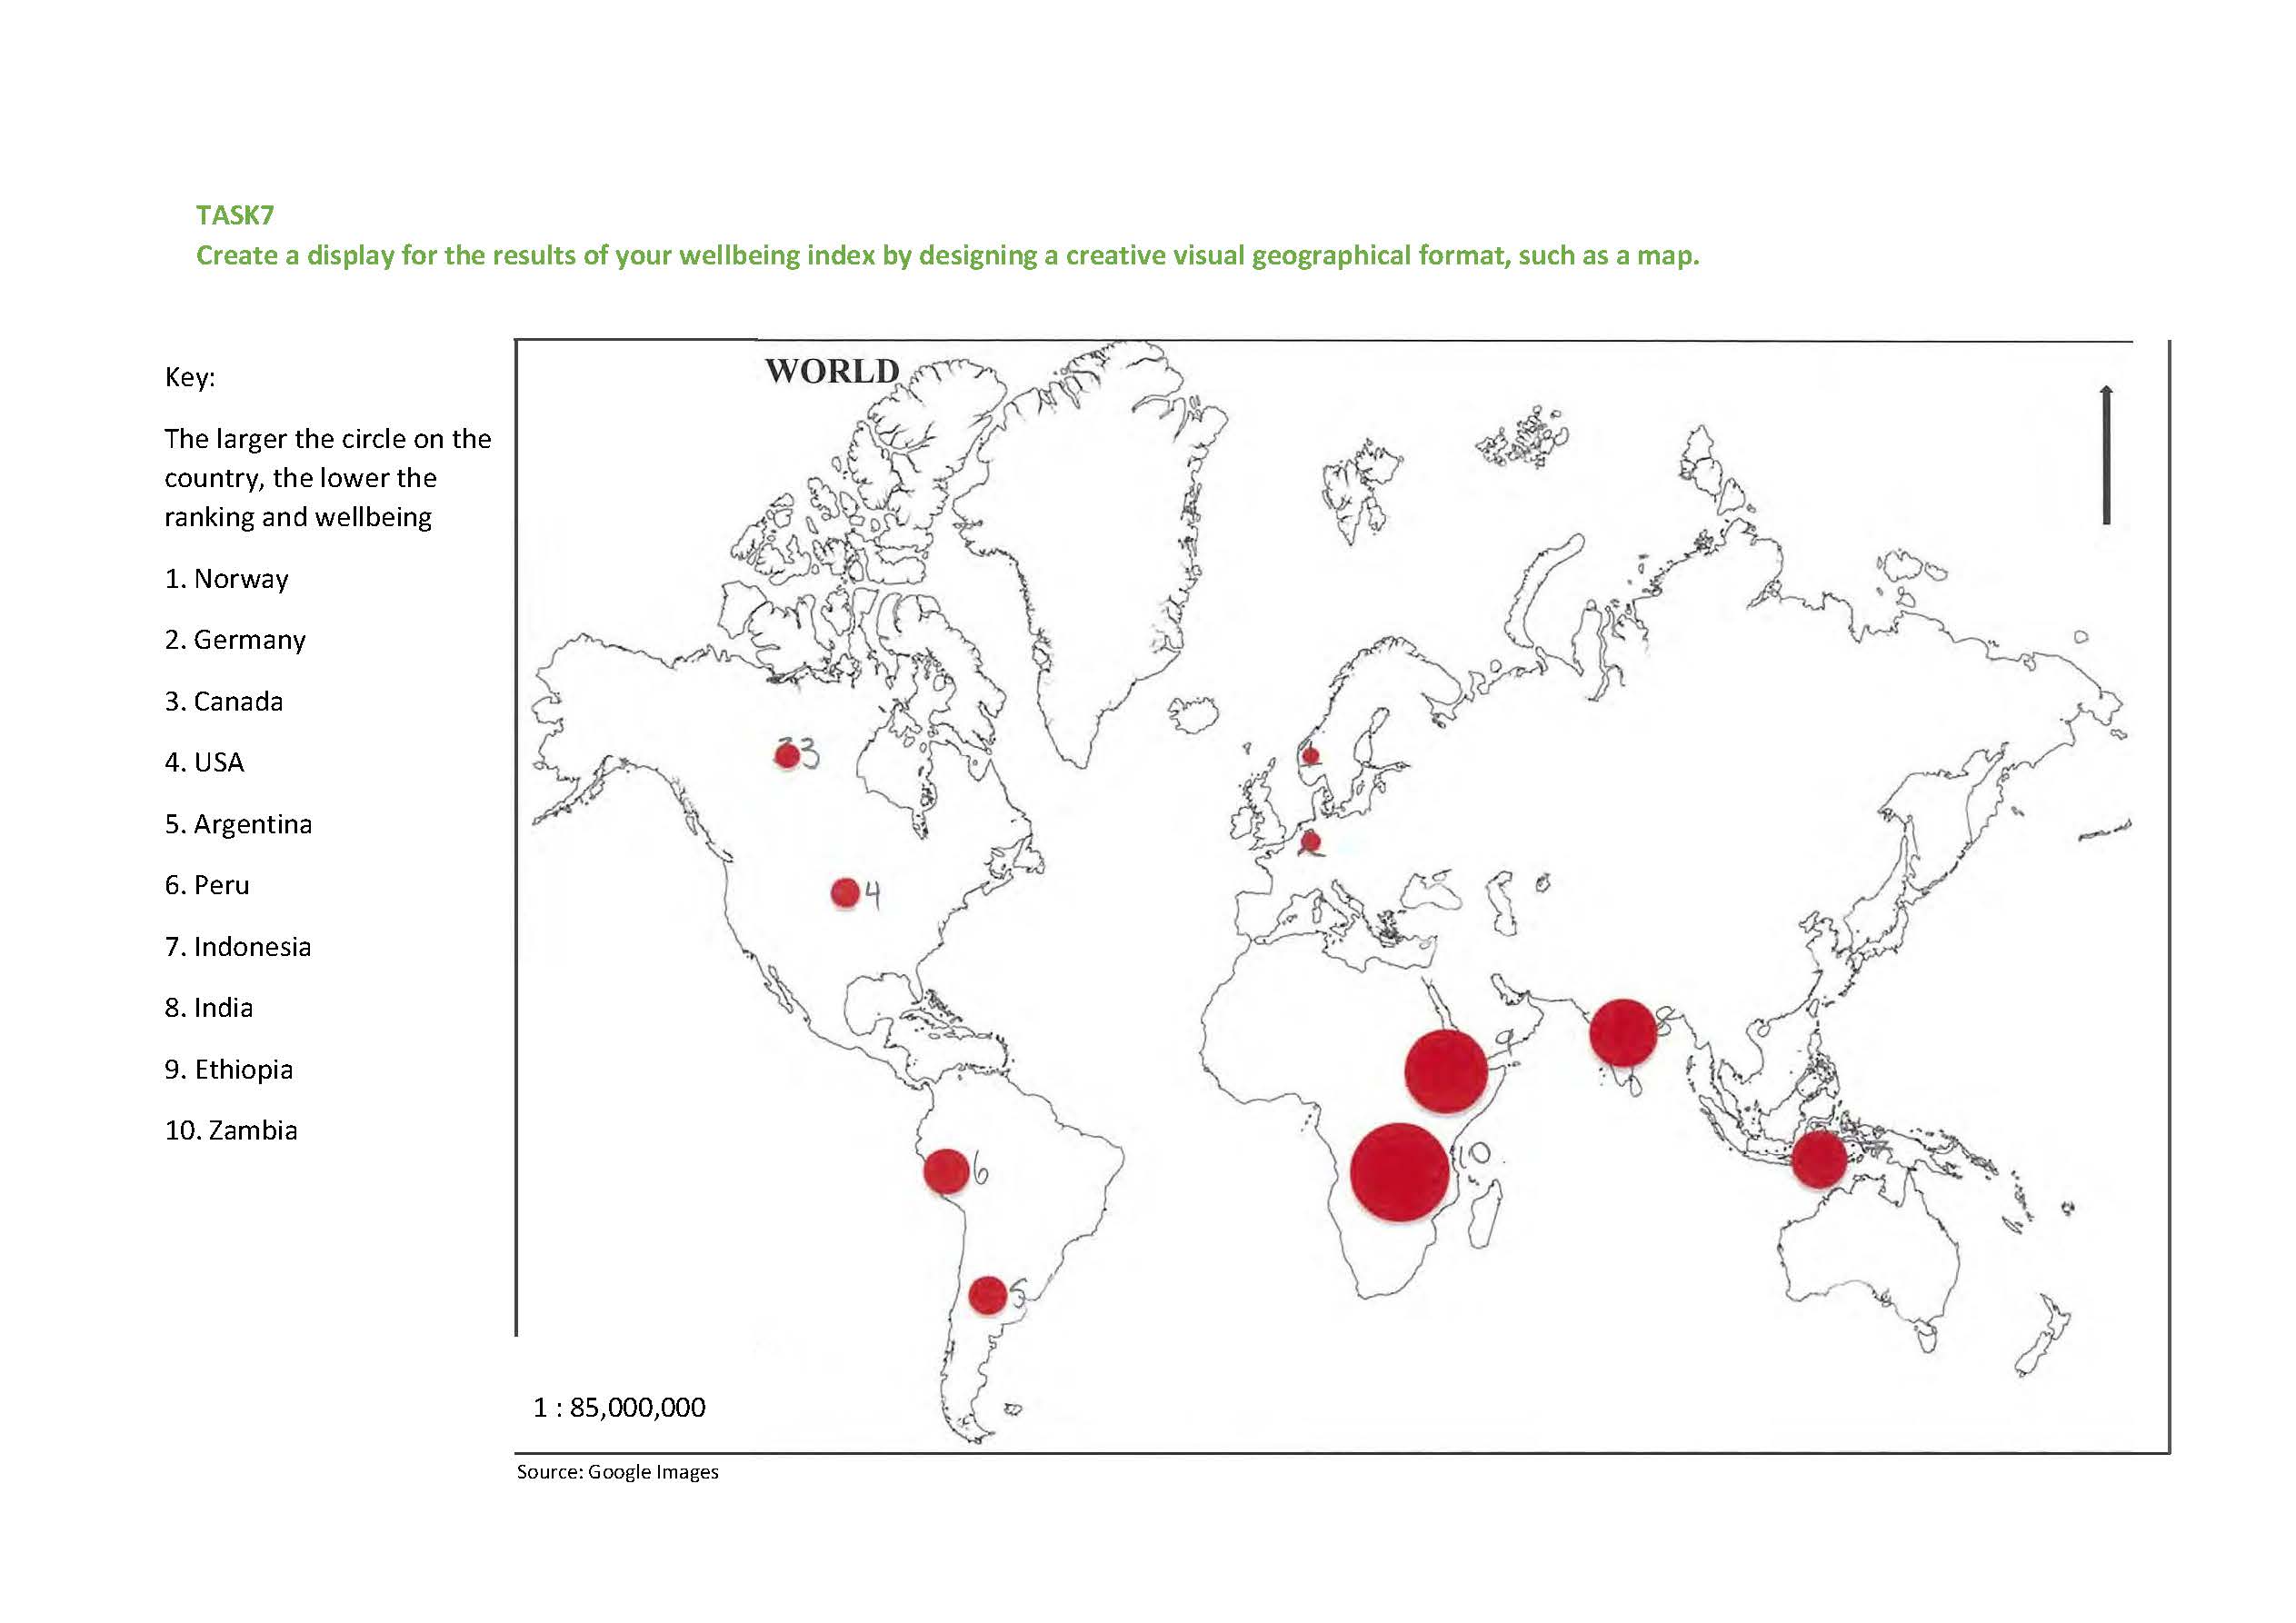
Uses suitable scale and cartographic conventions -
2
Annotation 2
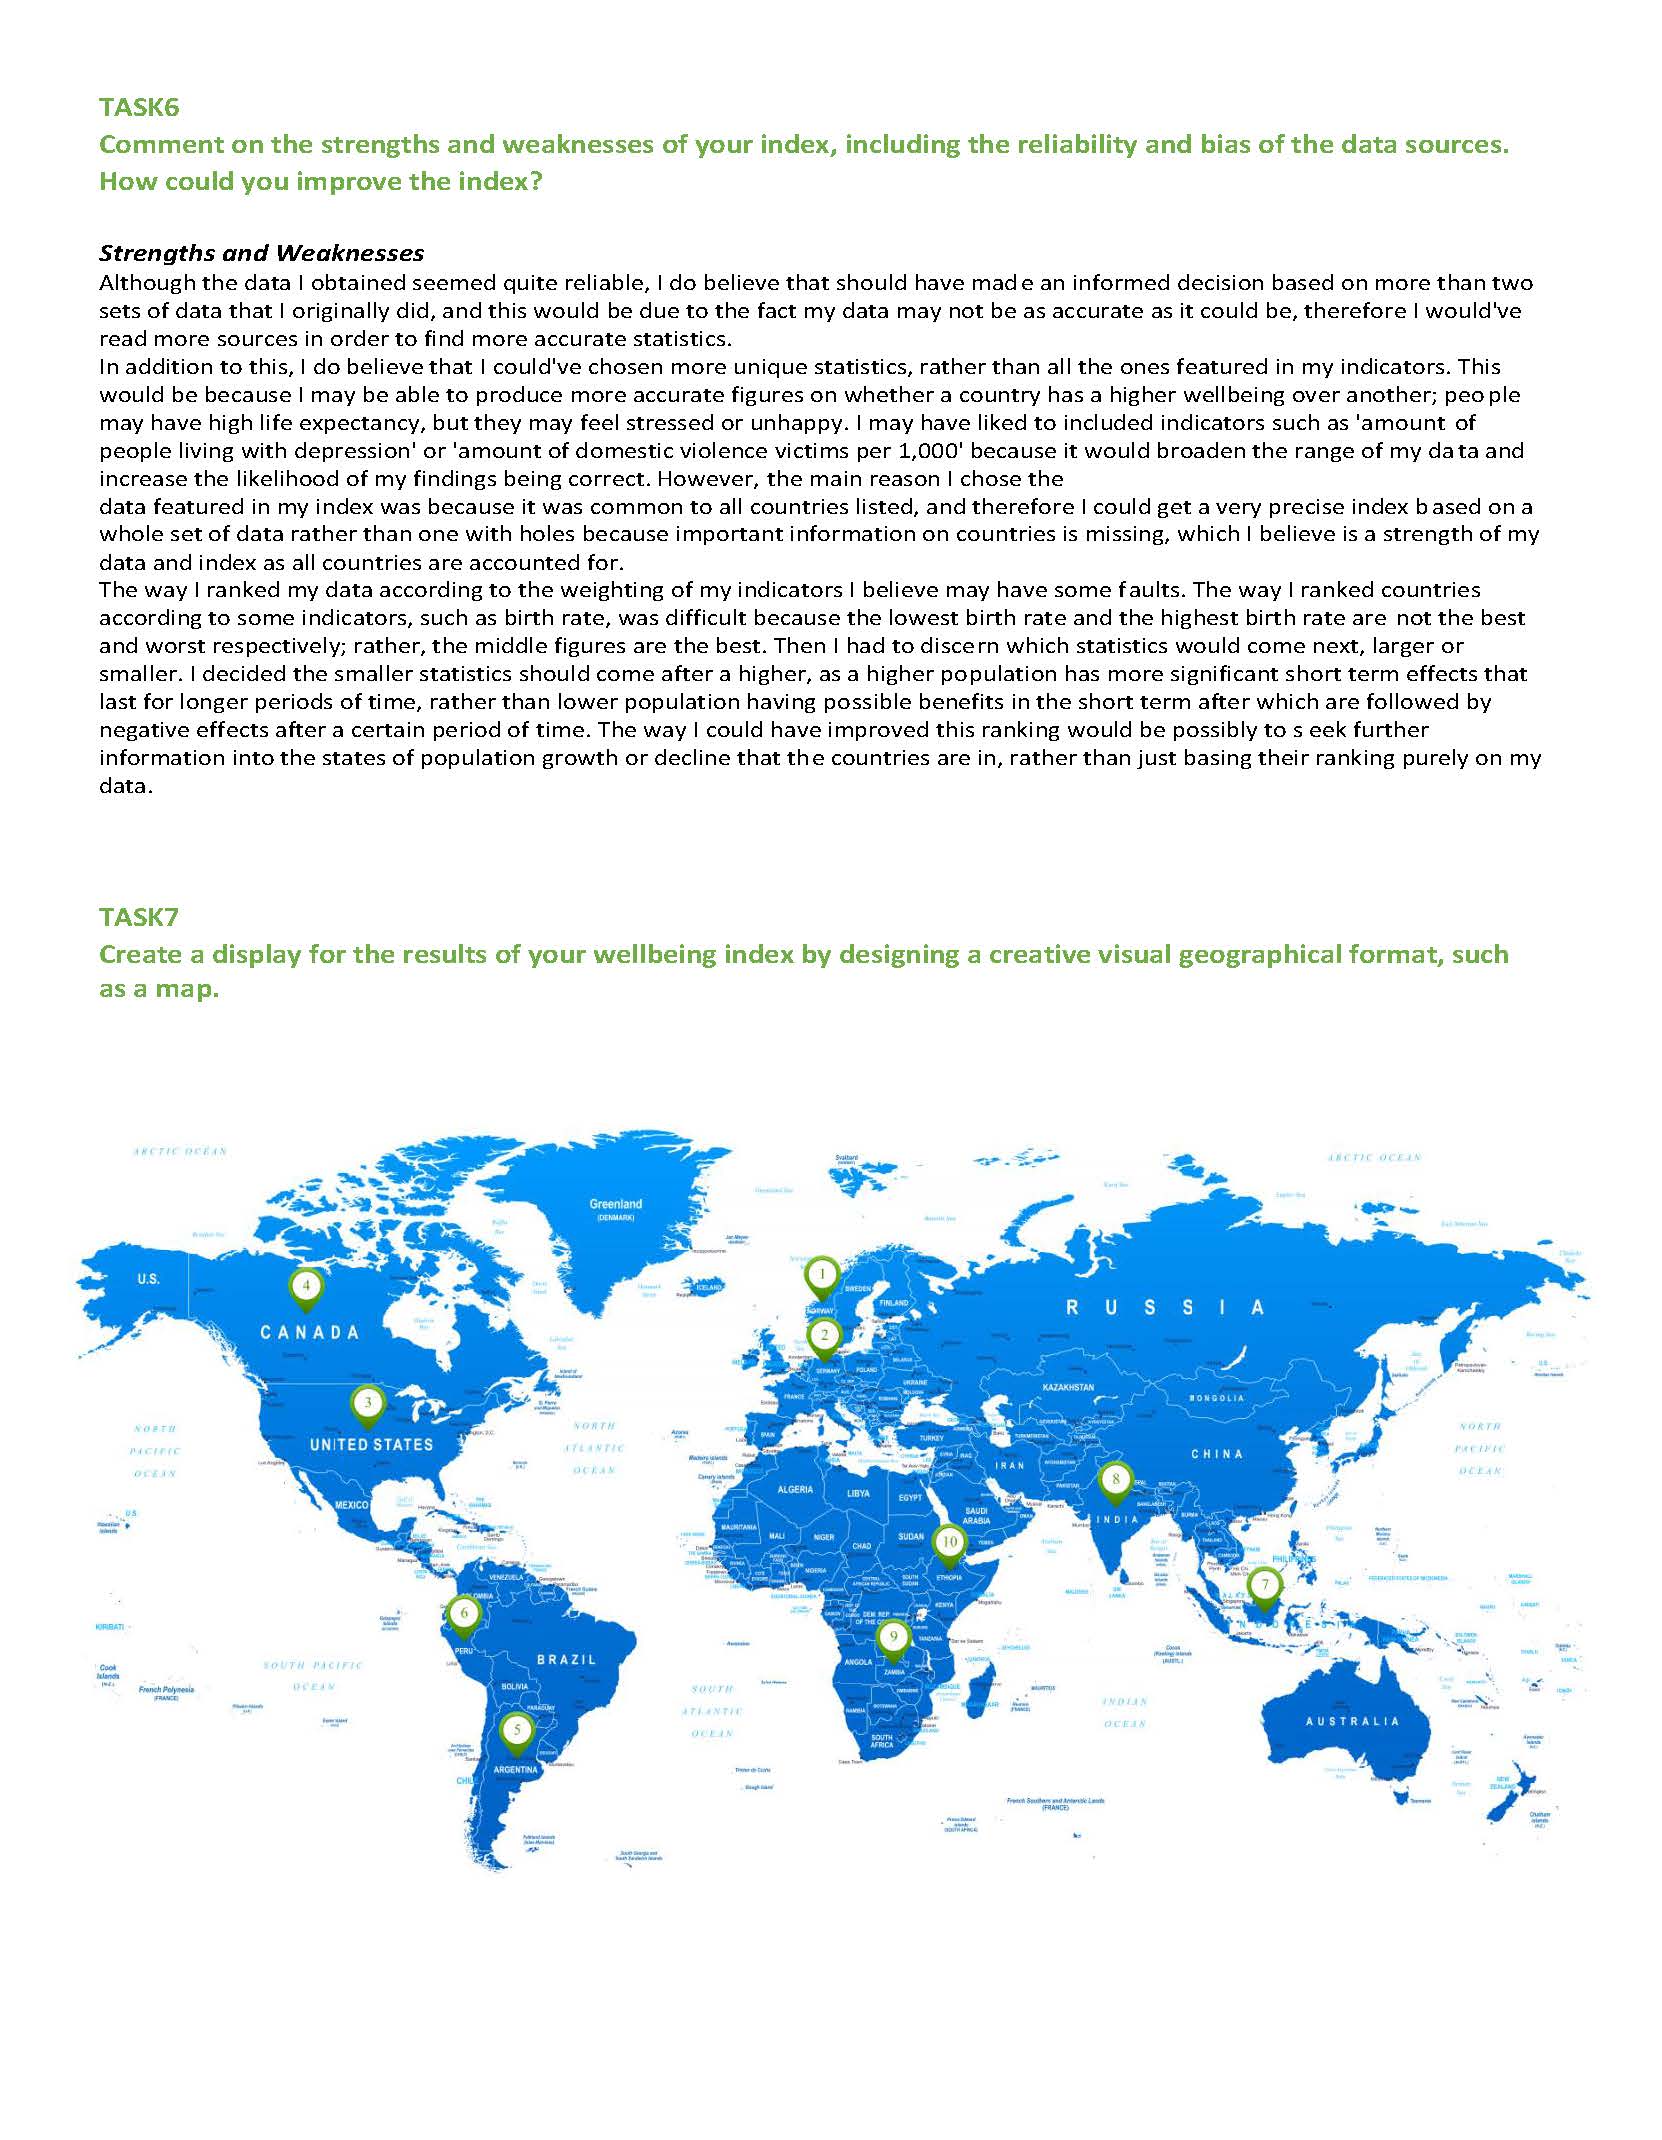
Interprets given data to create a data display map of relative wellbeing ranking -
3
Annotation 3
Uses a conventional legend to represent relative wellbeing across countries
Above satisfactory
Research assignment: Wellbeing indicators
 1
2
3
4
5
1
2
3
4
5
-
Annotations
-
1
Annotation 1
Identifies a variety of significant interconnections between people, places and environments -
2
Annotation 2
Explains a number of different significant relationships between GDP, places and people's wellbeing -
3
Annotation 3
Explains a number of different significant relationships between life expectancy and people's wellbeing -
4
Annotation 4
Explains a number of different significant relationships between access to electricity and wellbeing -
5
Annotation 5
Explains a range of changes that result from these interconnections and their consequences
 1
2
3
4
5
6
1
2
3
4
5
6
-
Annotations
-
1
Annotation 1
Explains a number of different significant relationships between unemployment and people's wellbeing -
2
Annotation 2
Explains a number of different significant relationships between access to doctors and people's wellbeing -
3
Annotation 3
Explains a number of different significant relationships between infant mortaliaity rates and people's wellbeing -
4
Annotation 4
Explains a number of different significant relationships between population growth and people's wellbeing -
5
Annotation 5
Explains a number of different significant relationships between adult literacy rates and people's wellbeing -
6
Annotation 6
Explains a number of different changes that result from these interconnections and their consequences
 1
2
3
4
1
2
3
4
-
Annotations
-
1
Annotation 1
Explains a number of different significant relationships between murder rate and people's wellbeing -
2
Annotation 2
Explains a number of different significant relationships between female employment and people's wellbeing -
3
Annotation 3
Uses relevant geographical terminology -
4
Annotation 4
Explains a number of different changes that result from these interconnections and their consequences
 1
1
-
Annotations
-
1
Annotation 1
Records data in an appropriate format with clear units of measurement associated with each indicator
 1
1
-
Annotations
-
1
Annotation 1
Constructs a wellbeing index that effectively ranks countries
 1
1
-
Annotations
-
1
Annotation 1
Specifies methods used to interpret and analyse data
 1
1
-
Annotations
-
1
Annotation 1
Analyses and synthesises data in a graphical format
 1
2
1
2
-
Annotations
-
1
Annotation 1
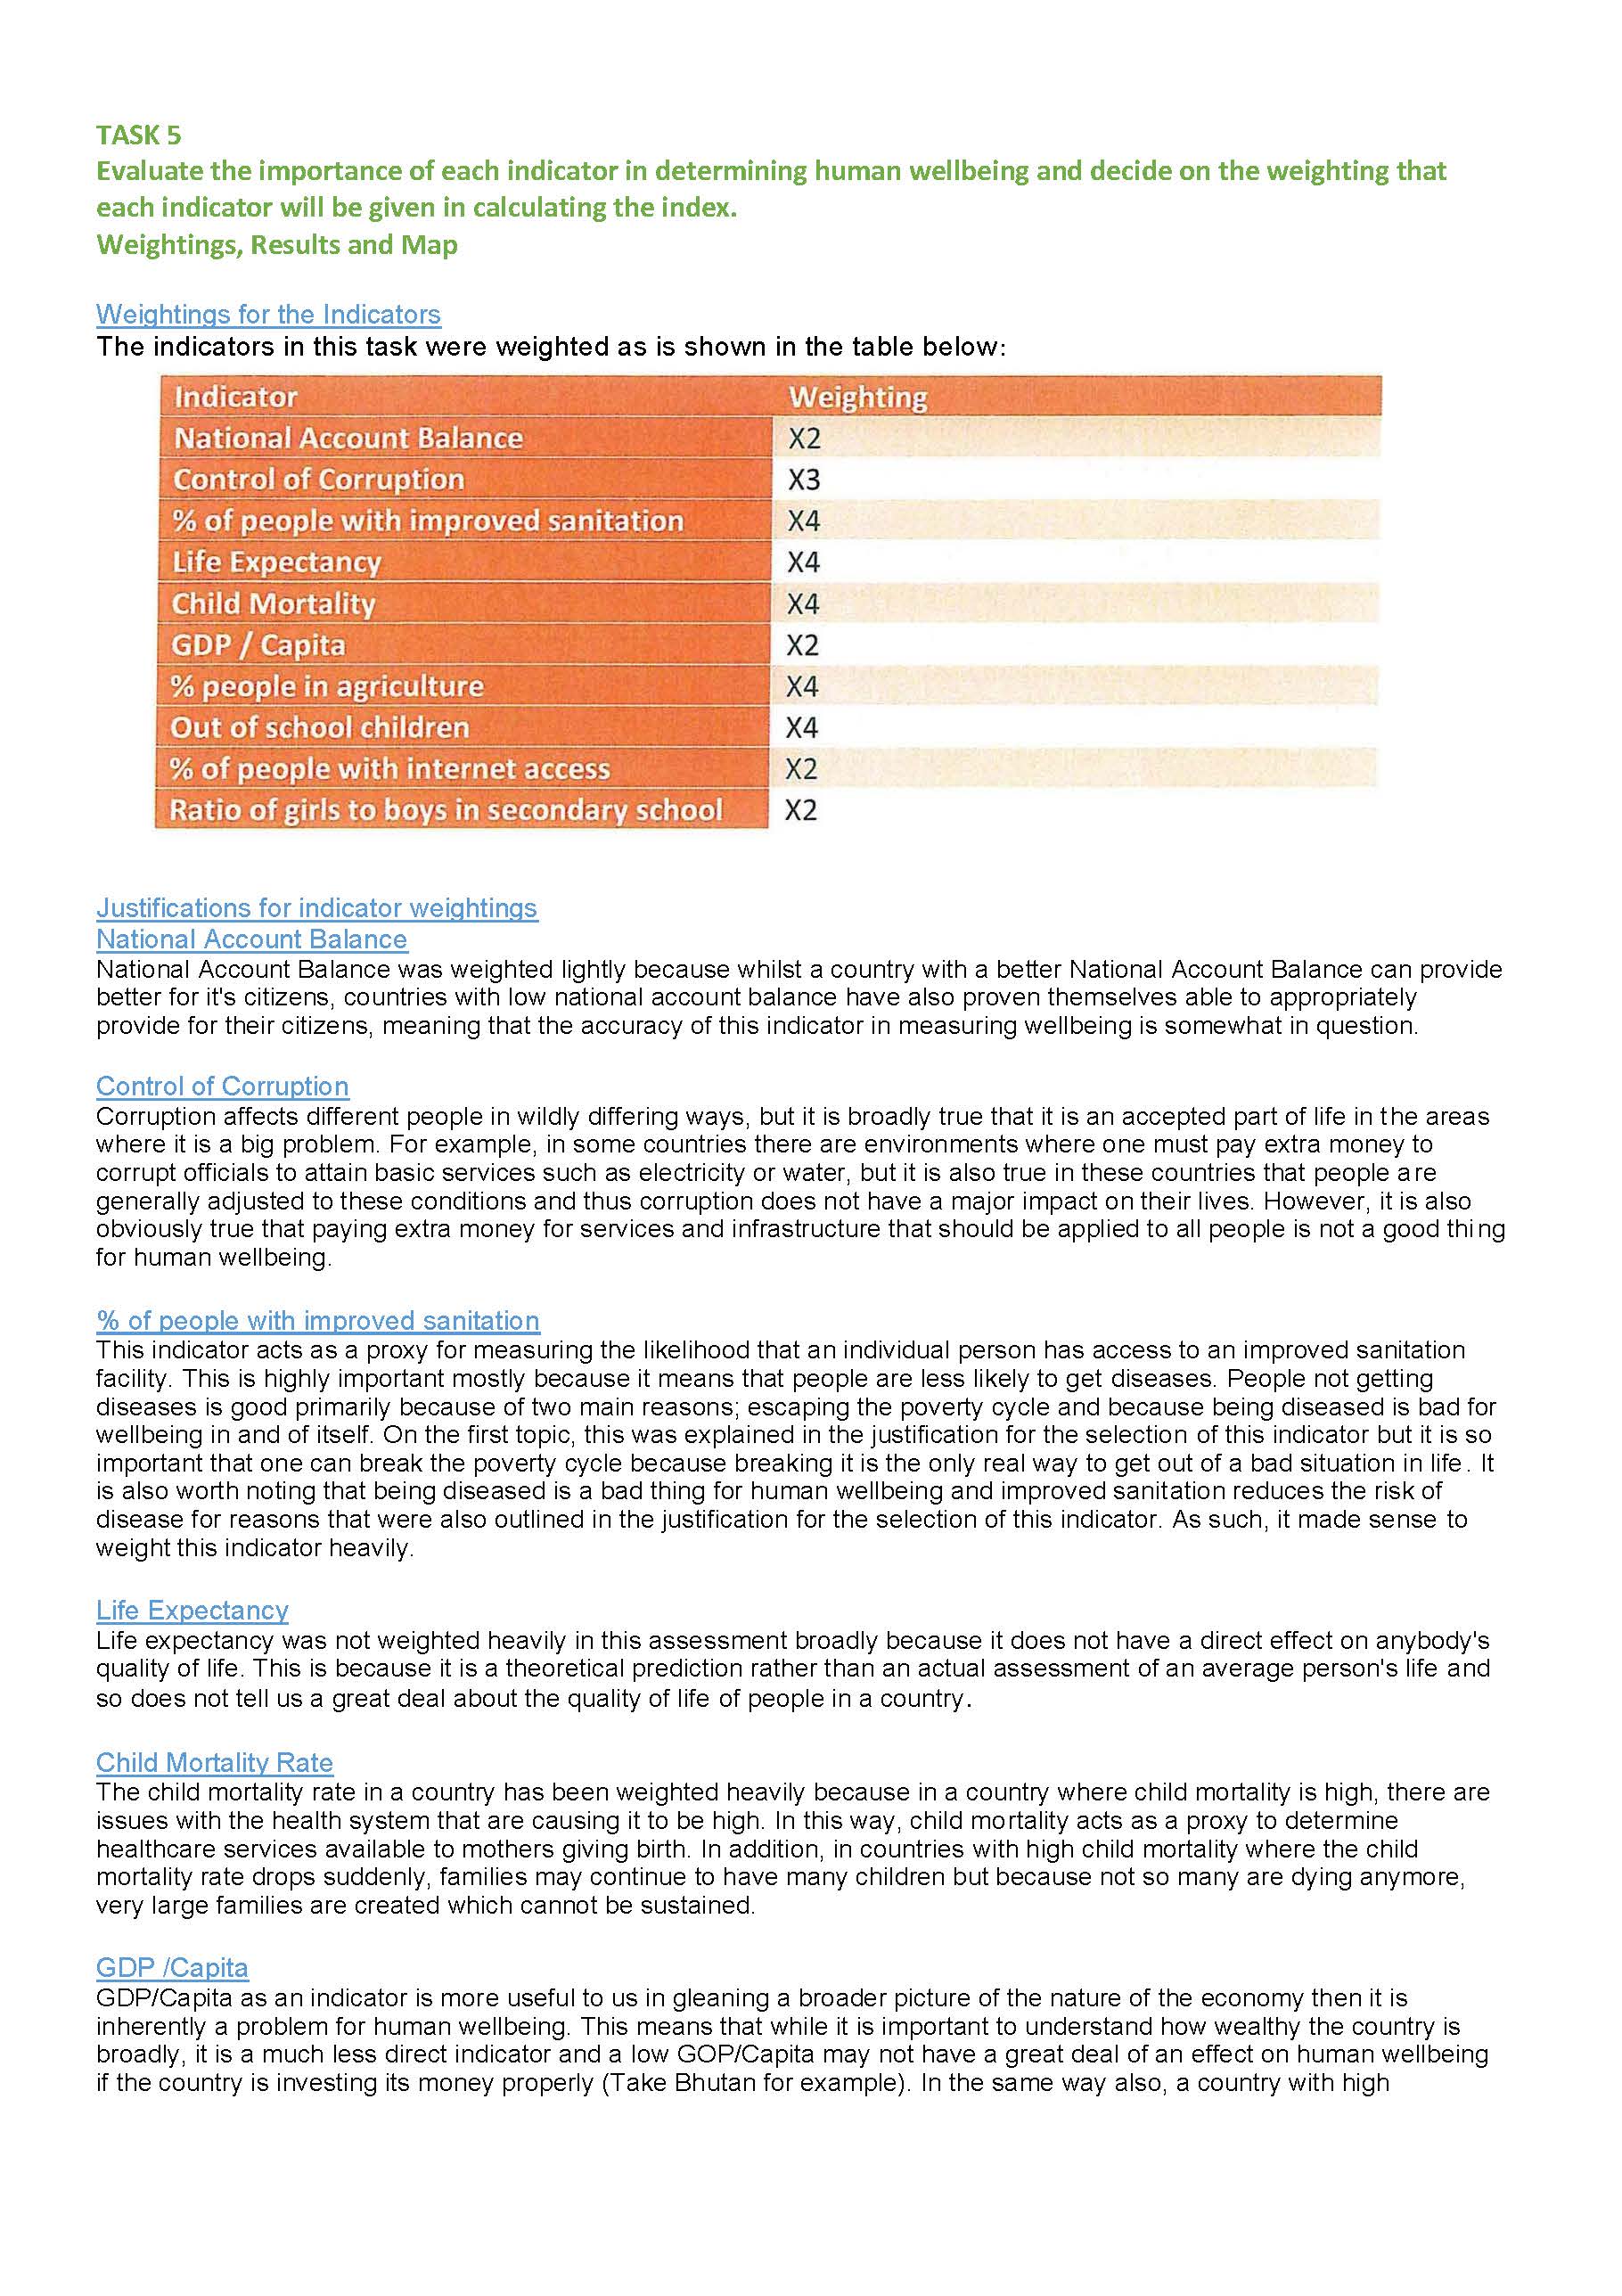
Clarifies information and systematically analyses the implications for the weighting of each indicator -
2
Annotation 2
Provides a number of specific examples to support the judgement being presented
 1
2
3
1
2
3
-
Annotations
-
1
Annotation 1
Clarifies information and systematically analyses the implications for the weighting of each indicator -
2
Annotation 2
Uses relevant geographical terminology -
3
Annotation 3
Provides a number of specific examples to support the judgements being presented
 1
2
3
4
1
2
3
4
-
Annotations
-
1
Annotation 1
Makes explicit connections between the specific data sources and the effectiveness of the index -
2
Annotation 2
Identifies clearly the strengths and weaknesses of the findings -
3
Annotation 3
Presents at least one area for improvement and analyses the specific reasons for these changes -
4
Annotation 4
Presents a reasoned analysis of the reliability of the chosen data sources
 1
2
3
1
2
3
-
Annotations
-
1
Annotation 1
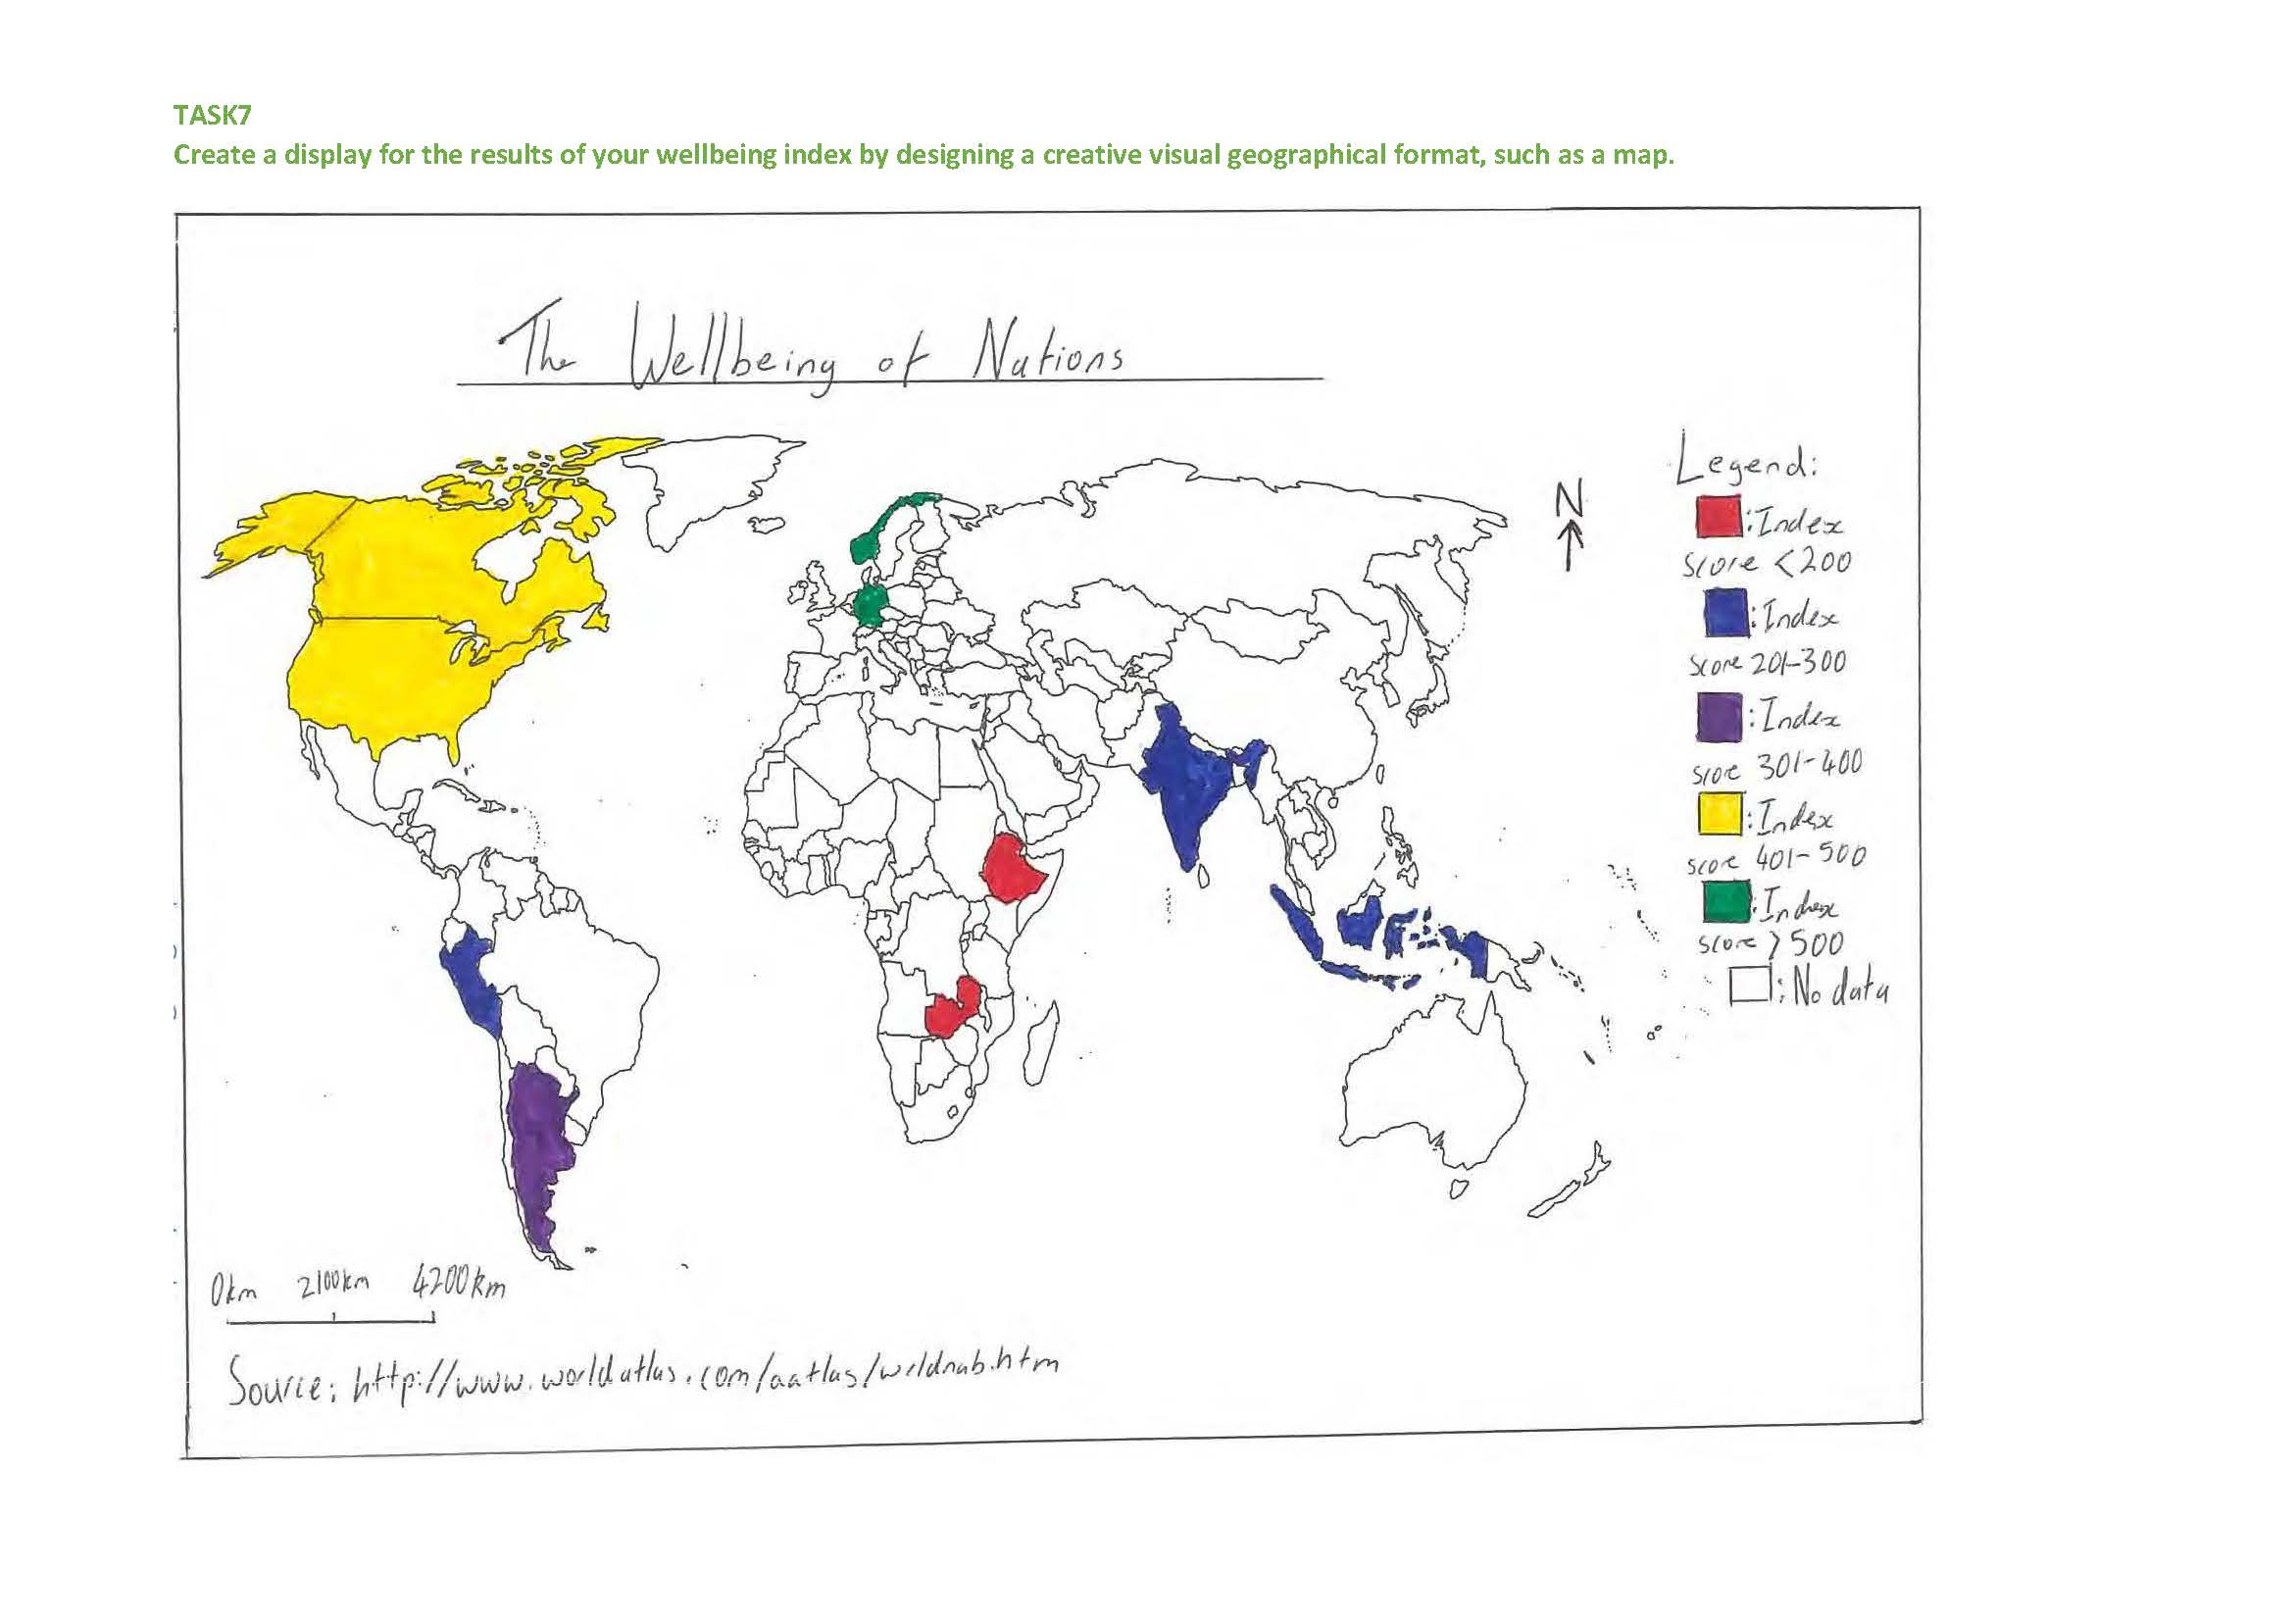
Uses suitable scale and cartographic conventions -
2
Annotation 2
Interprets given data to create a data display map of relative wellbeing ranking -
3
Annotation 3
Designs a symbolic system to represent relative rankings across countries
Below satisfactory
Research assignment: Wellbeing indicators
 1
2
3
4
1
2
3
4
-
Annotations
-
1
Annotation 1
Identifies some significant interconnections between people, places and environments -
2
Annotation 2
Provides a simple explanation of the relationship between GDP and people's wellbeing -
3
Annotation 3
Provides a simple explanation of the relationship between unemployment and people's wellbeing -
4
Annotation 4
Provides a simple explanation of the relationship between life expectancy and people's wellbeing
 1
2
3
4
5
6
7
1
2
3
4
5
6
7
-
Annotations
-
1
Annotation 1
Provides a simple explanation of the relationship between infant mortality and people's wellbeing -
2
Annotation 2
Provides a simple explanation of the relationship between poverty rate and people's wellbeing -
3
Annotation 3
Provides an explanation of the relationship between access to clean water and people's wellbeing -
4
Annotation 4
Provides an explanation of the relationship between birth rate and people's wellbeing -
5
Annotation 5
Provides a simple explanation of the relationship between literacy rates and people's wellbeing -
6
Annotation 6
Provides a simple explanation of the relationship between population and people's wellbeing -
7
Annotation 7
Provides a partial explanation of changes that can result from these interconnections and their consequences
 1
2
3
1
2
3
-
Annotations
-
1
Annotation 1
Provides a simple explanation of the relationship between employment in agricultural and people's wellbeing -
2
Annotation 2
Uses some relevant geographical terminology -
3
Annotation 3
Records data in a partially completed chart
 1
2
1
2
-
Annotations
-
1
Annotation 1
Constructs a list of countries according to wellbeing -
2
Annotation 2
Presents a basic evaluation of each indicator with simple reasoning
 1
2
3
4
5
1
2
3
4
5
-
Annotations
-
1
Annotation 1
Makes partial connections between the data sources and the proposed conclusions -
2
Annotation 2
Makes a simple inference about the reliability of the chosen data sources -
3
Annotation 3
Makes a basic reflection on the strengths and weaknesses of the findings -
4
Annotation 4
Presents one area for improvement with one reason for making the change -
5
Annotation 5
Places the rankings on a map
Satisfactory
Research assignment: Wellbeing indicators
1
2
3
4
-
Annotations
-
1
Annotation 1
Identifies significant interconnections between people, places and environments -
2
Annotation 2
Explains some significant relationships between control of corruption and people's wellbeing -
3
Annotation 3
Explains some significant relationships between GDP and people's wellbeing -
4
Annotation 4
Explains some changes that result from these interconnections and their consequences
1
2
3
4
5
6
7
8
9
10
-
Annotations
-
1
Annotation 1
Explains the relationship between schooling and people's wellbeing -
2
Annotation 2
Explains the relationship between sanitation and people's wellbeing -
3
Annotation 3
Explains the relationship between child mortality and people's wellbeing -
4
Annotation 4
Explains the relationship between agricultural employment and people's wellbeing -
5
Annotation 5
Explains the relationship between life expectancy and people's wellbeing -
6
Annotation 6
Explains the relationship between gender, education and people's wellbeing -
7
Annotation 7
Explains the relationship between national account balance and people's wellbeing -
8
Annotation 8
Explains the relationship between internet access and people's wellbeing -
9
Annotation 9
Explains some changes that result from these interconnections and their consequence -
10
Annotation 10
Uses relevant geographical terminology
1
-
Annotations
-
1
Annotation 1
Records data in an appropriate format
1
2
3
-
Annotations
-
1
Annotation 1
Analyses and synthesises data to draw relevant conclusions -
2
Annotation 2
Uses relevant geographical terminology -
3
Annotation 3
Constructs a wellbeing index that ranks countries
1
2
3
-
Annotations
-
1
Annotation 1
Indicates the processes used to interpret and analyse data -
2
Annotation 2
Provides some specific examples to support the judgement being presented -
3
Annotation 3
Clarifies information and analyses the implications for the indicators
1
2
3
4
5
6
7
-
Annotations
-
1
Annotation 1
Provides some specific examples to support the judgement being presented -
2
Annotation 2
Clarifies information and analyses the implications for the indicator -
3
Annotation 3
Uses relevant geographical terminology -
4
Annotation 4
States the reliability of the chosen data -
5
Annotation 5
Identifies the strengths and weaknesses of the findings -
6
Annotation 6
Makes connections between the specific data sources and the effectiveness of the index -
7
Annotation 7
Presents more than one area for improvement and presents the specific reasons for making these changes
1
2
3
-
Annotations
-
1
Annotation 1
Uses suitable scale and cartographic conventions -
2
Annotation 2
Interprets given data to create a data display map of relative wellbeing ranking -
3
Annotation 3
Uses a conventional legend to represent relative wellbeing across countries