Satisfactory
Solar car experiment
 1
2
3
1
2
3
-
Annotations
-
1
Annotation 1
Processes data using spreadsheet software -
2
Annotation 2
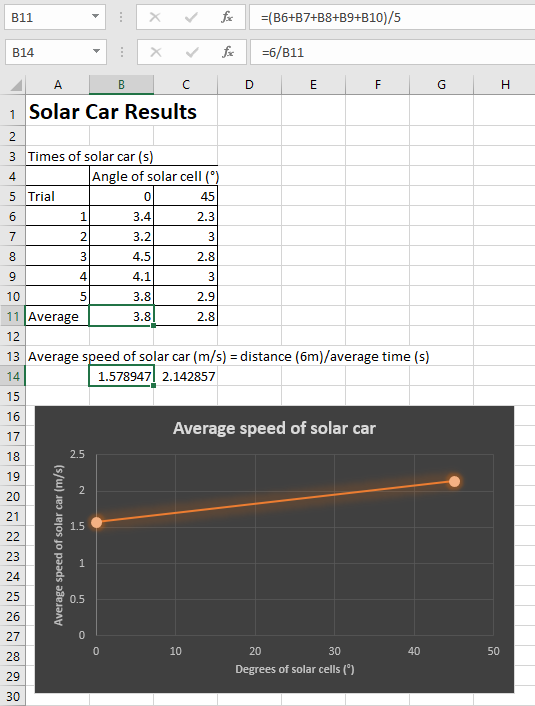
Creates table to represent data -
3
Annotation 3
Creates well-labelled line graph to present results
 1
2
3
1
2
3
-
Annotations
-
1
Annotation 1
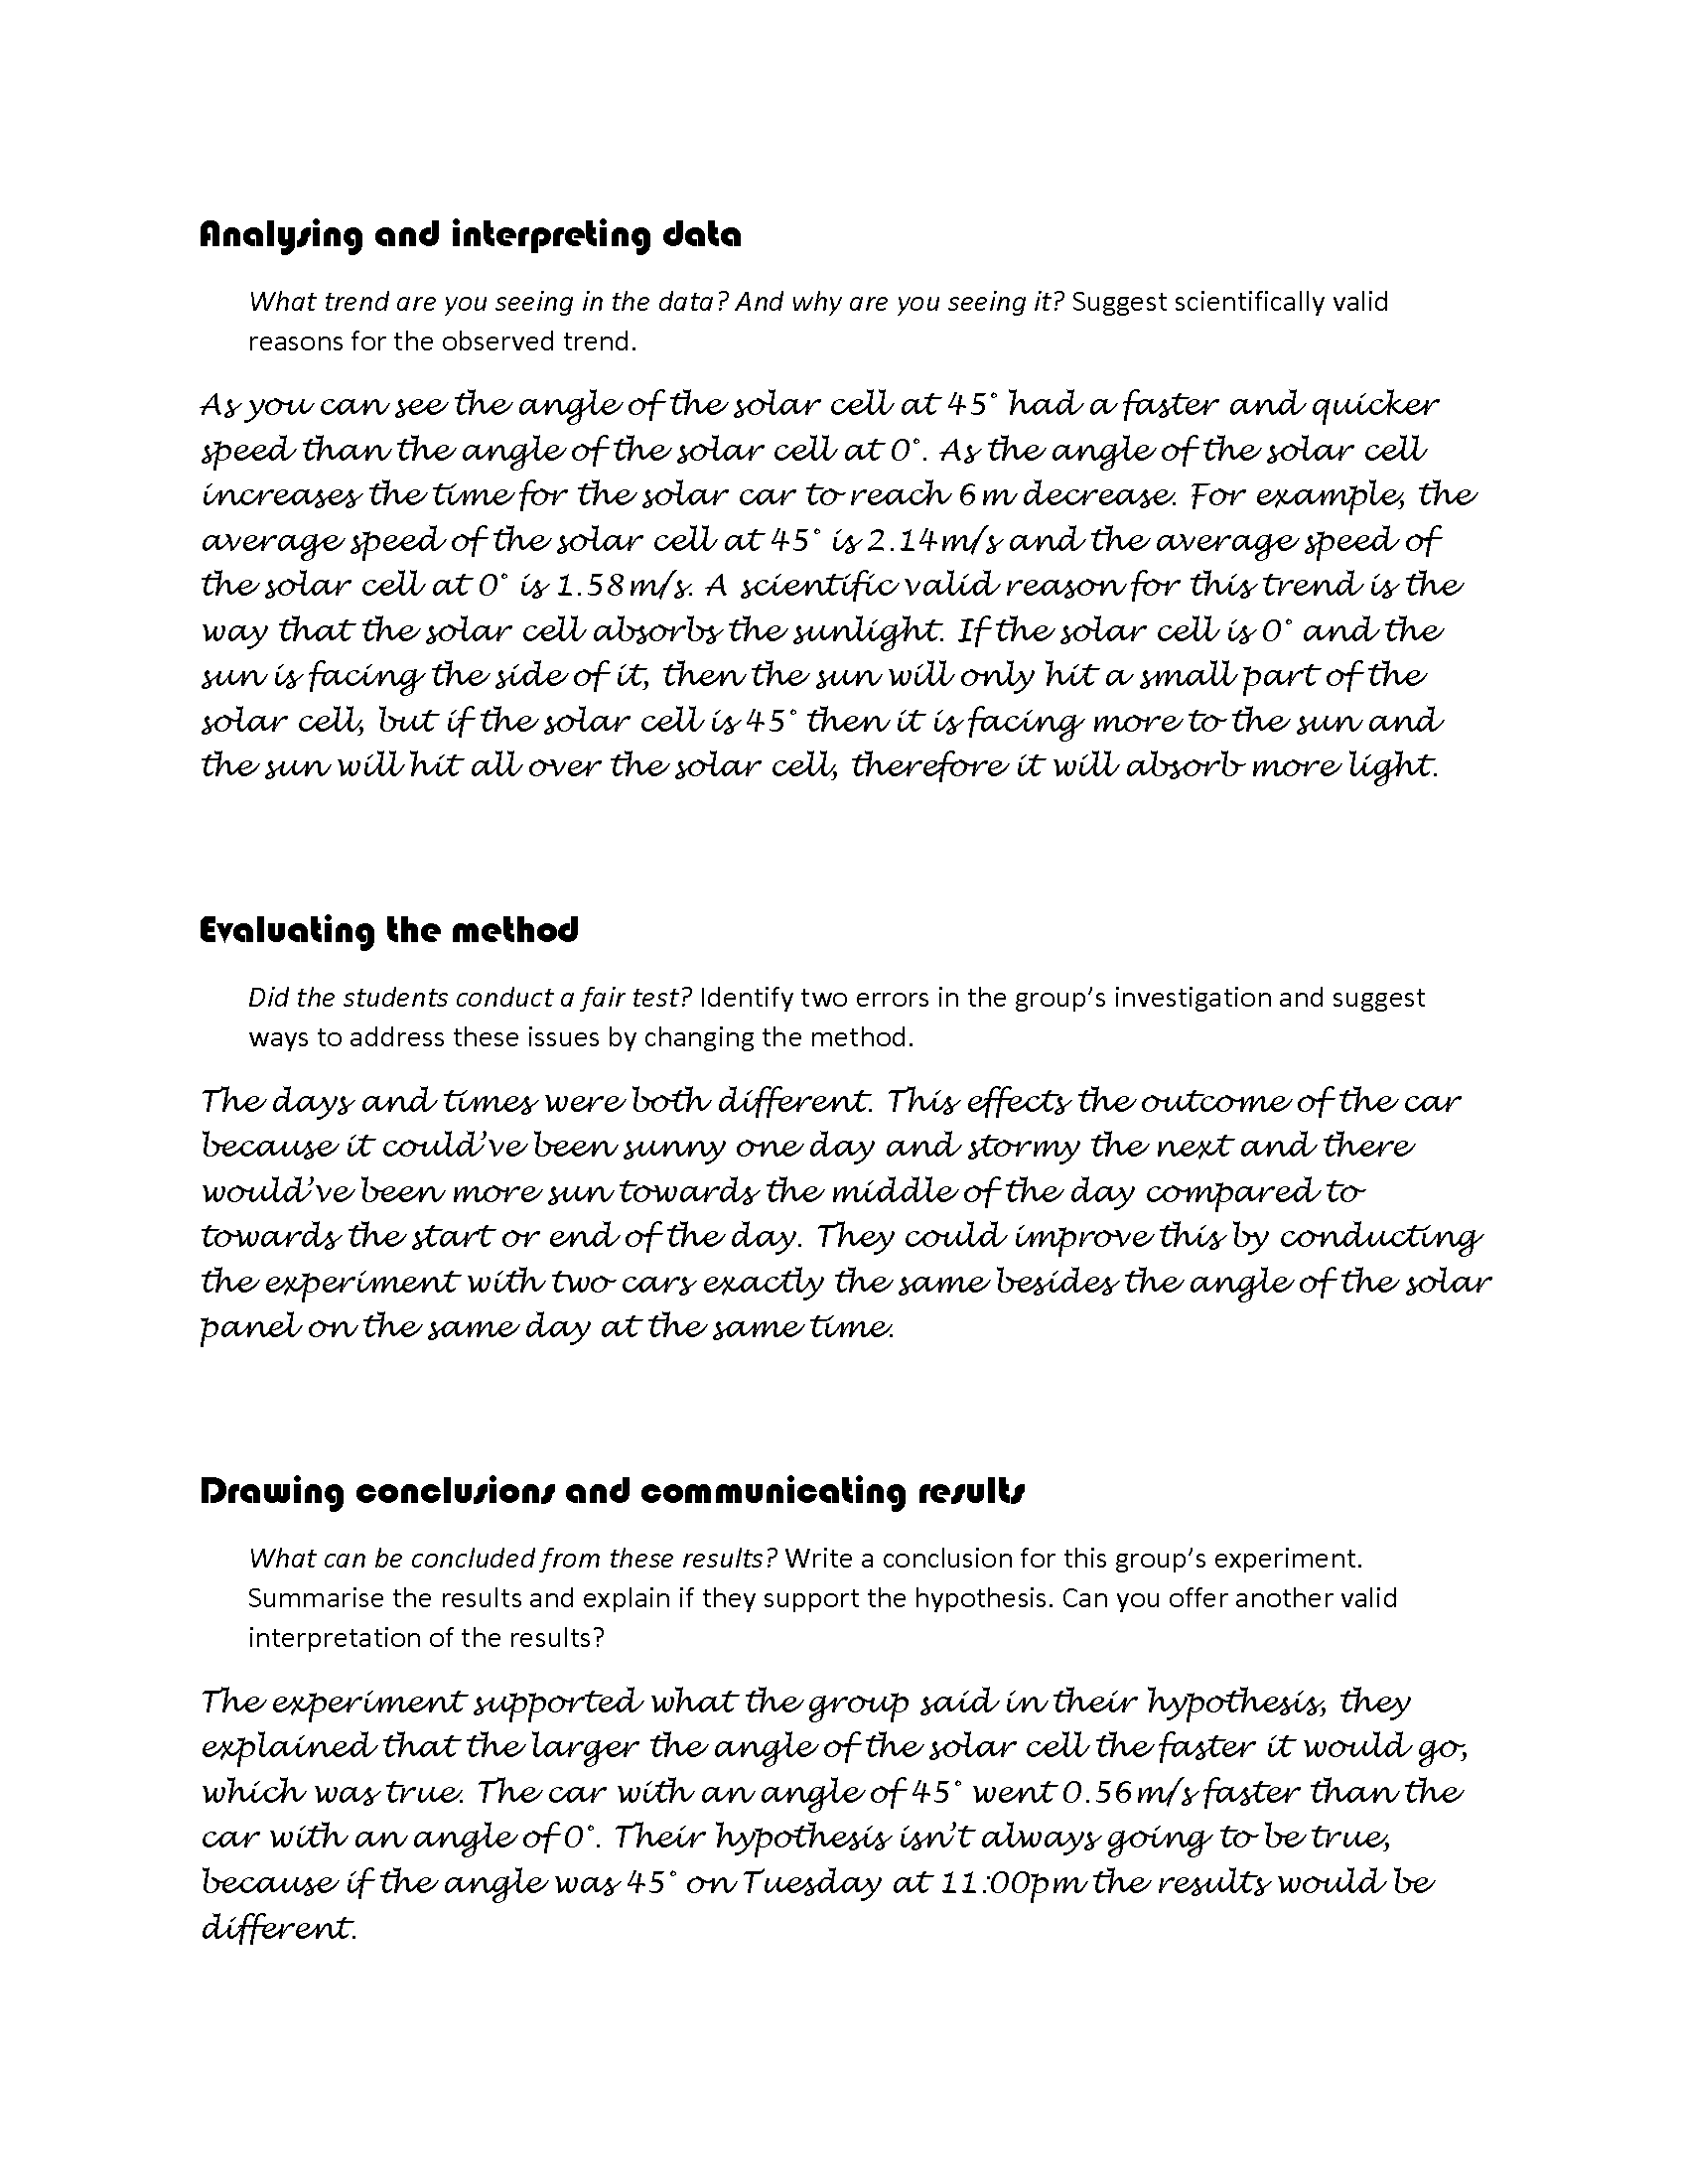
Uses scientific reasoning to explain observed trend in data -
2
Annotation 2
Identifies errors in experimental method and suggests valid improvements -
3
Annotation 3
Concludes that results support hypothesis but questions validity of claim by referencing experimental flaw
Above satisfactory
Solar car experiment
 1
2
3
1
2
3
-
Annotations
-
1
Annotation 1
Processes data efficiently using built-in software functionality -
2
Annotation 2
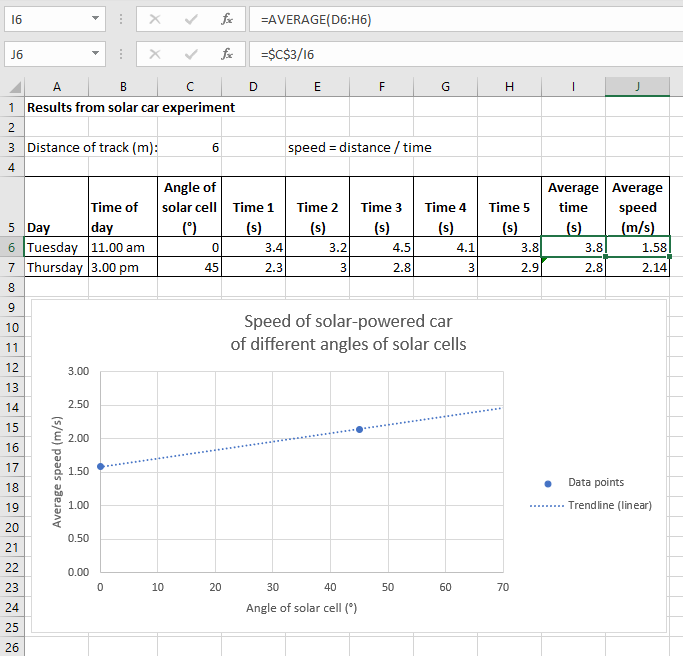
Presents data in logically organised table -
3
Annotation 3
Creates well-labelled line graph to present results, including trendline extrapolated beyond measuring range
 1
2
3
1
2
3
-
Annotations
-
1
Annotation 1
Uses scientific reasoning and precise scientific language to explain observed trend in data -
2
Annotation 2
Identifies errors in experimental method, explains why they could have affected results, suggests valid improvements -
3
Annotation 3
Concludes that results support hypothesis but questions validity of claim by offering scientifically equally valid alternative interpretation
Satisfactory
Solar car experiment
1
2
3
-
Annotations
-
1
Annotation 1
Processes data using spreadsheet software -
2
Annotation 2
Creates table to represent data -
3
Annotation 3
Creates well-labelled line graph to present results
1
2
3
-
Annotations
-
1
Annotation 1
Uses scientific reasoning to explain observed trend in data -
2
Annotation 2
Identifies errors in experimental method and suggests valid improvements -
3
Annotation 3
Concludes that results support hypothesis but questions validity of claim by referencing experimental flaw