Data analysis: Water in the world
Summary of task
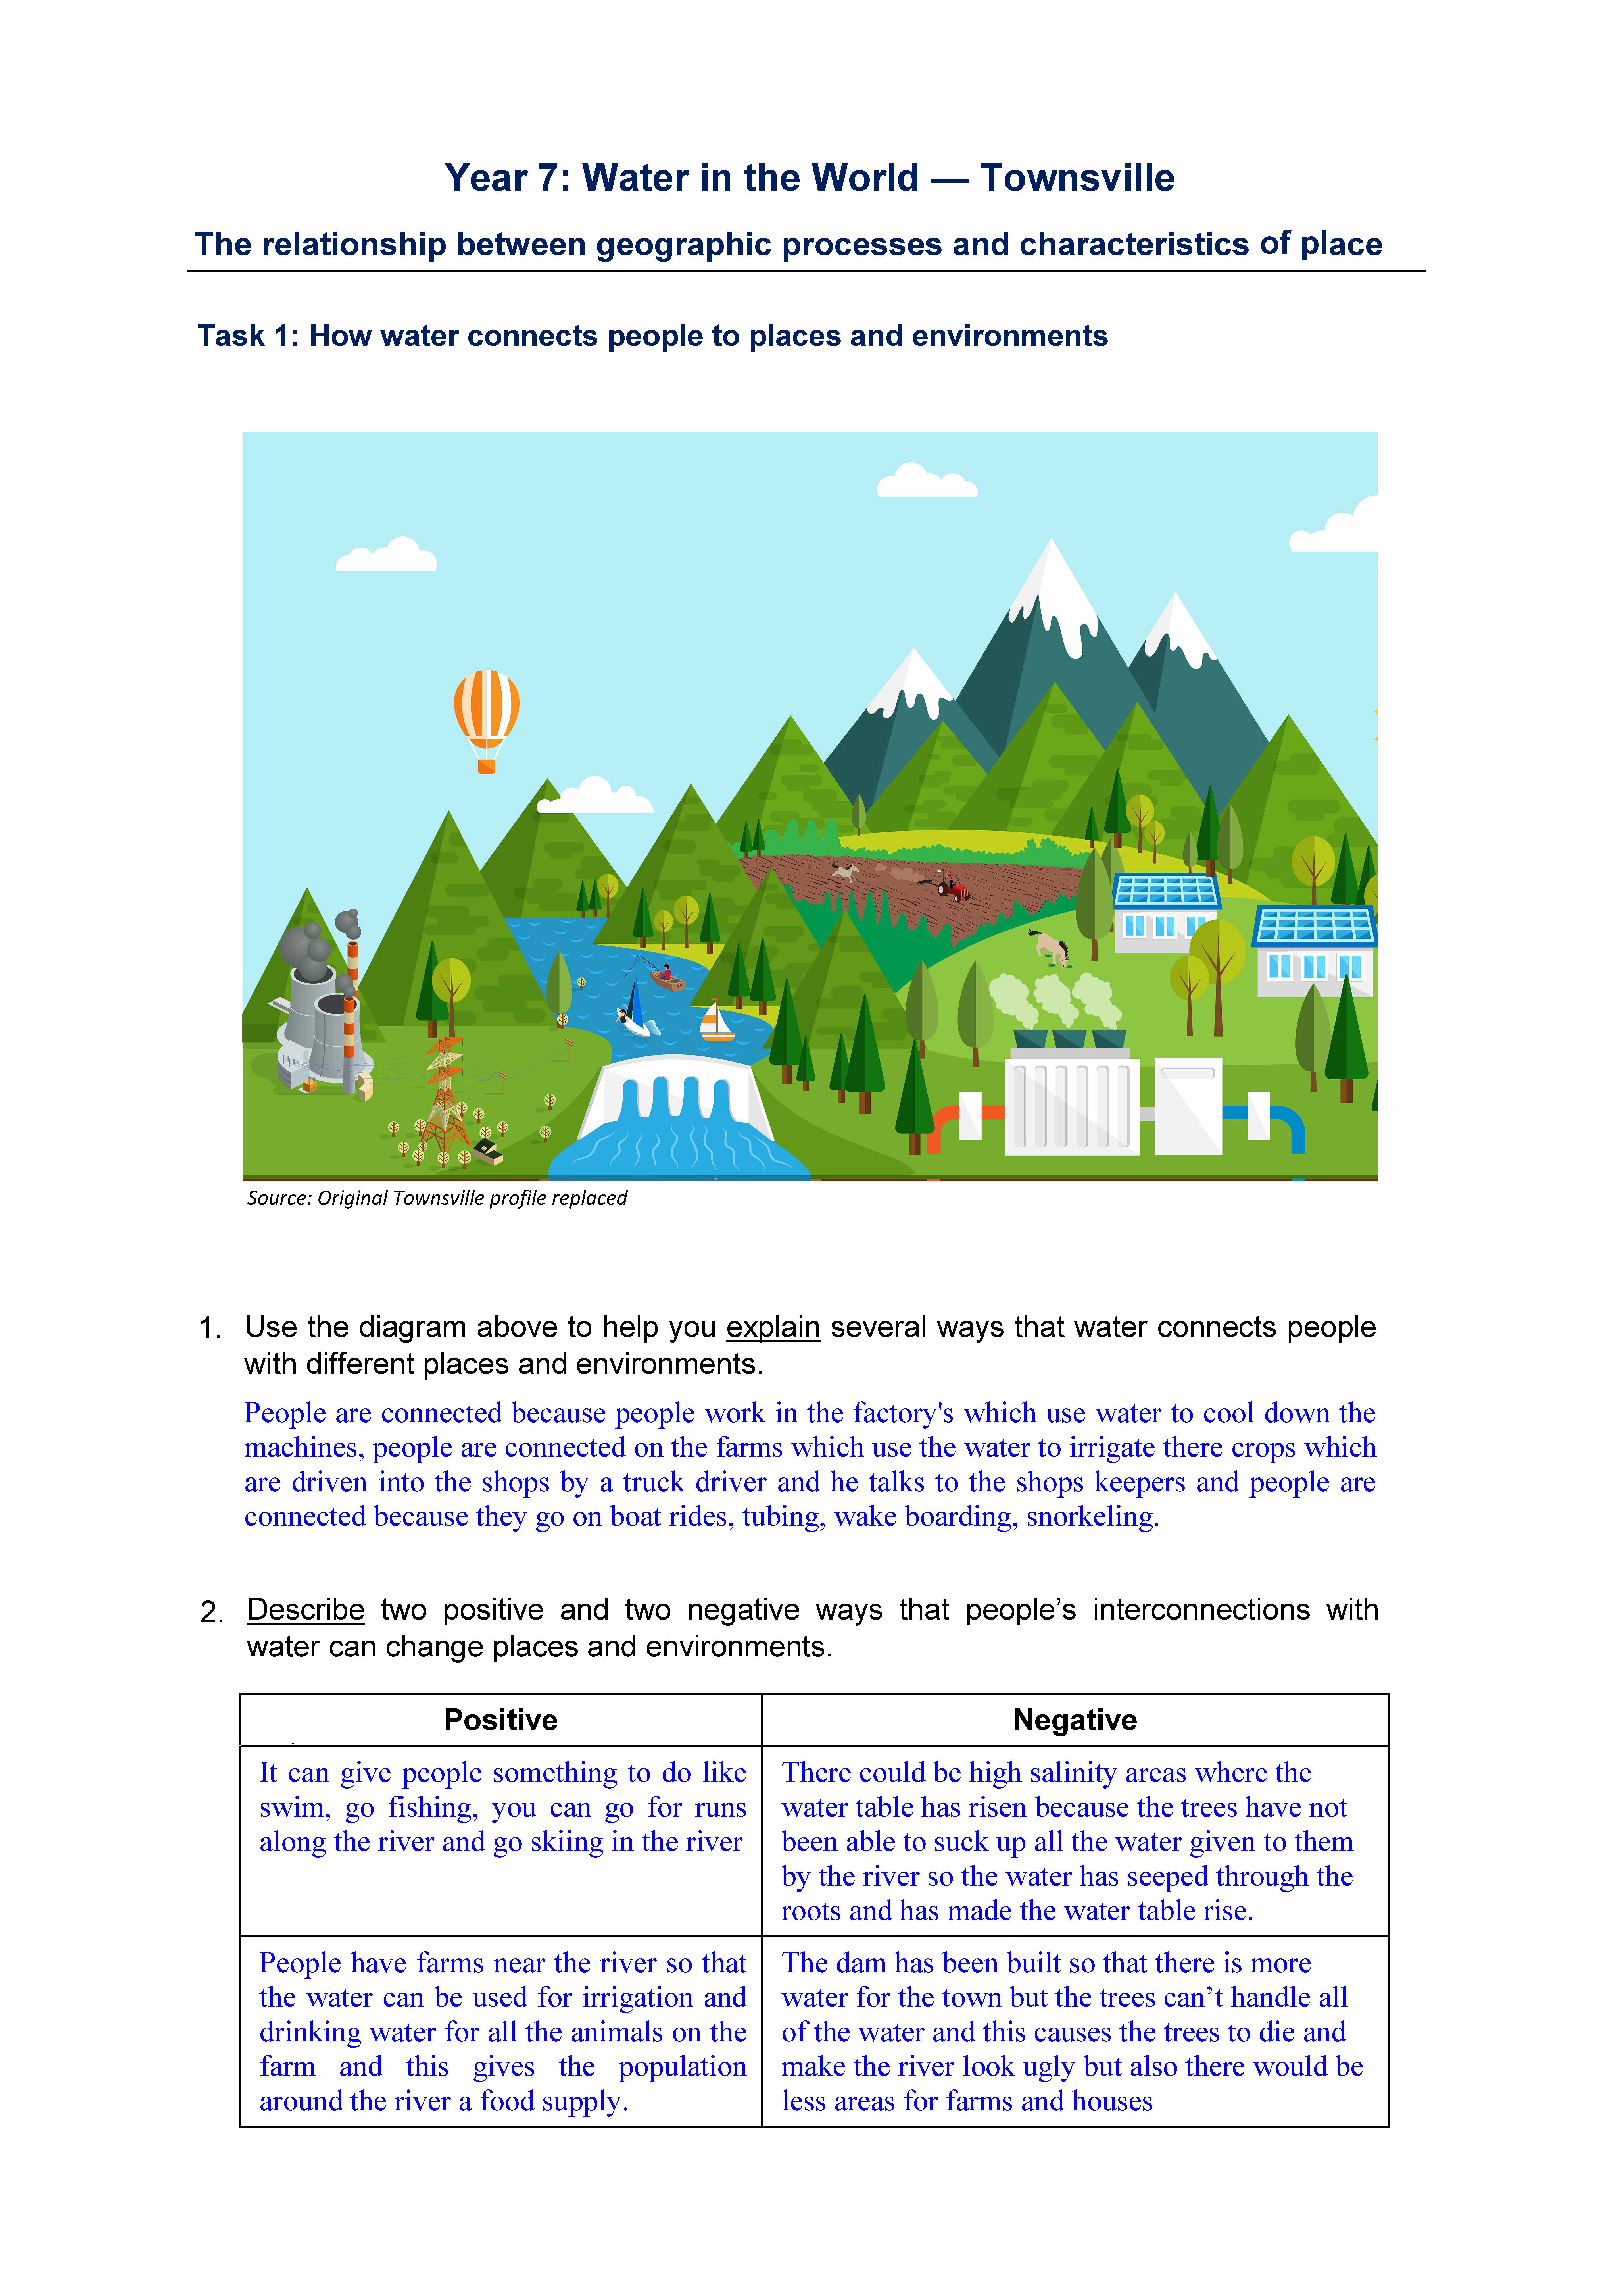
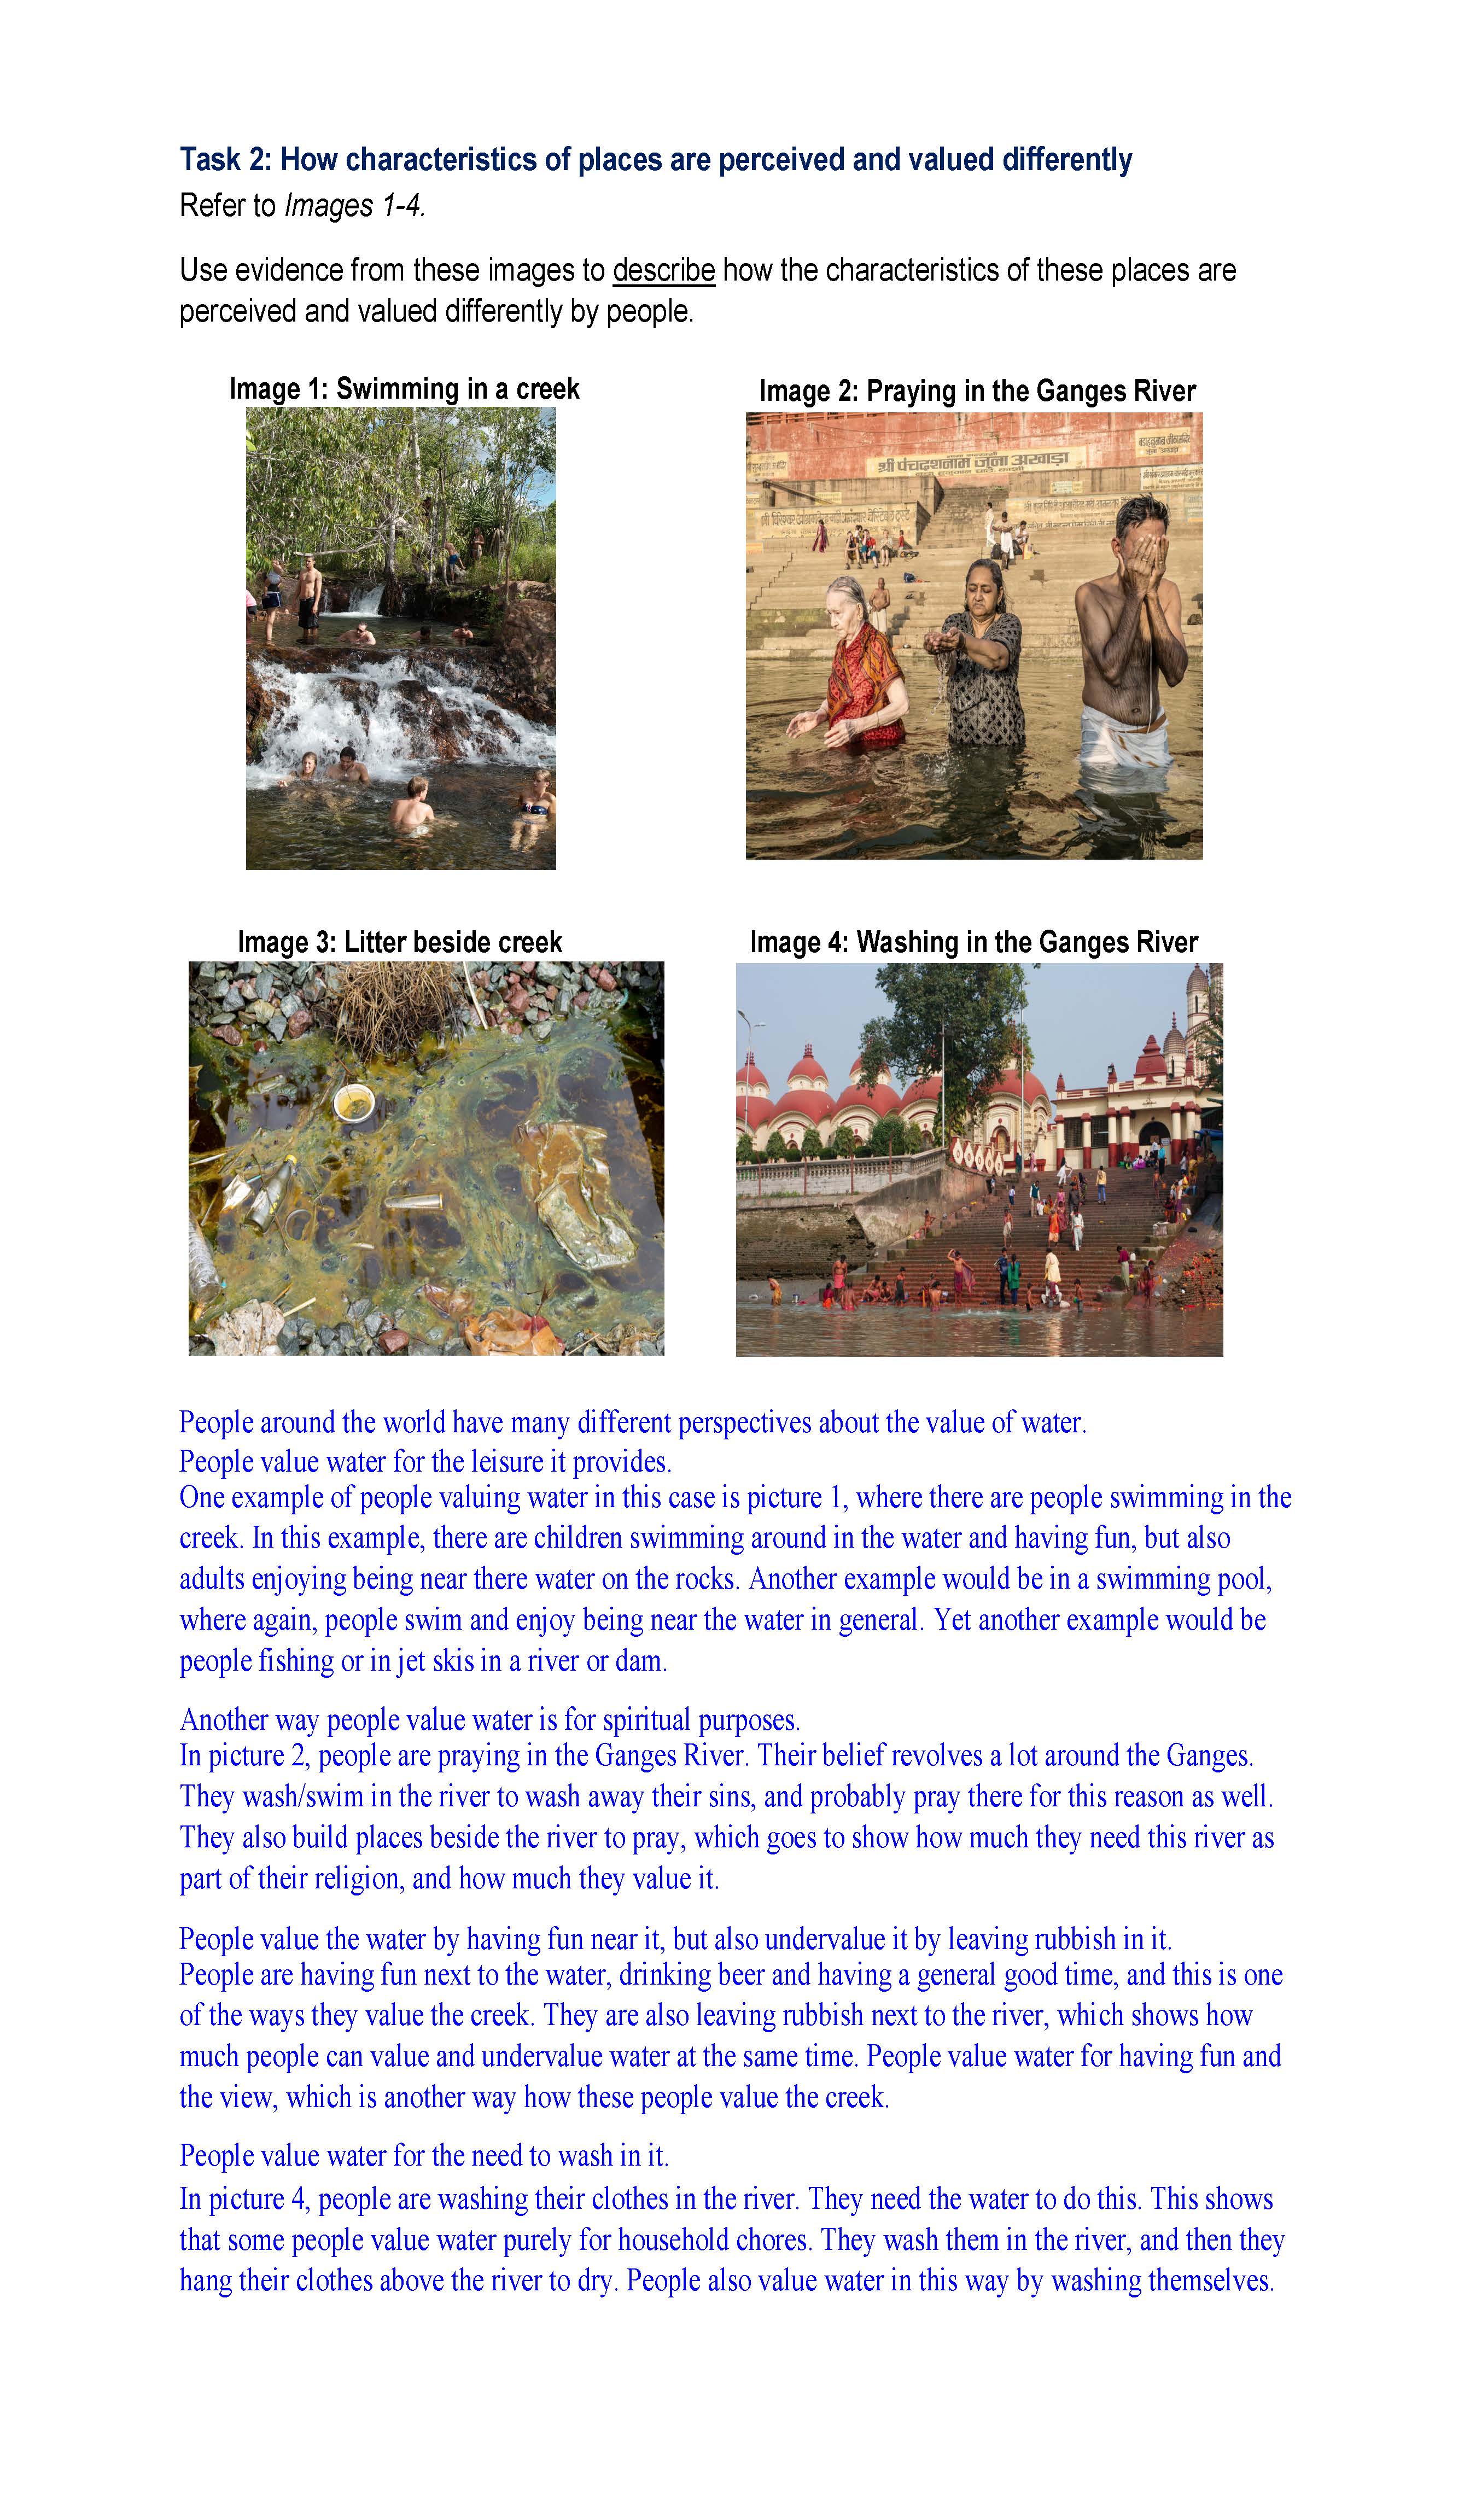
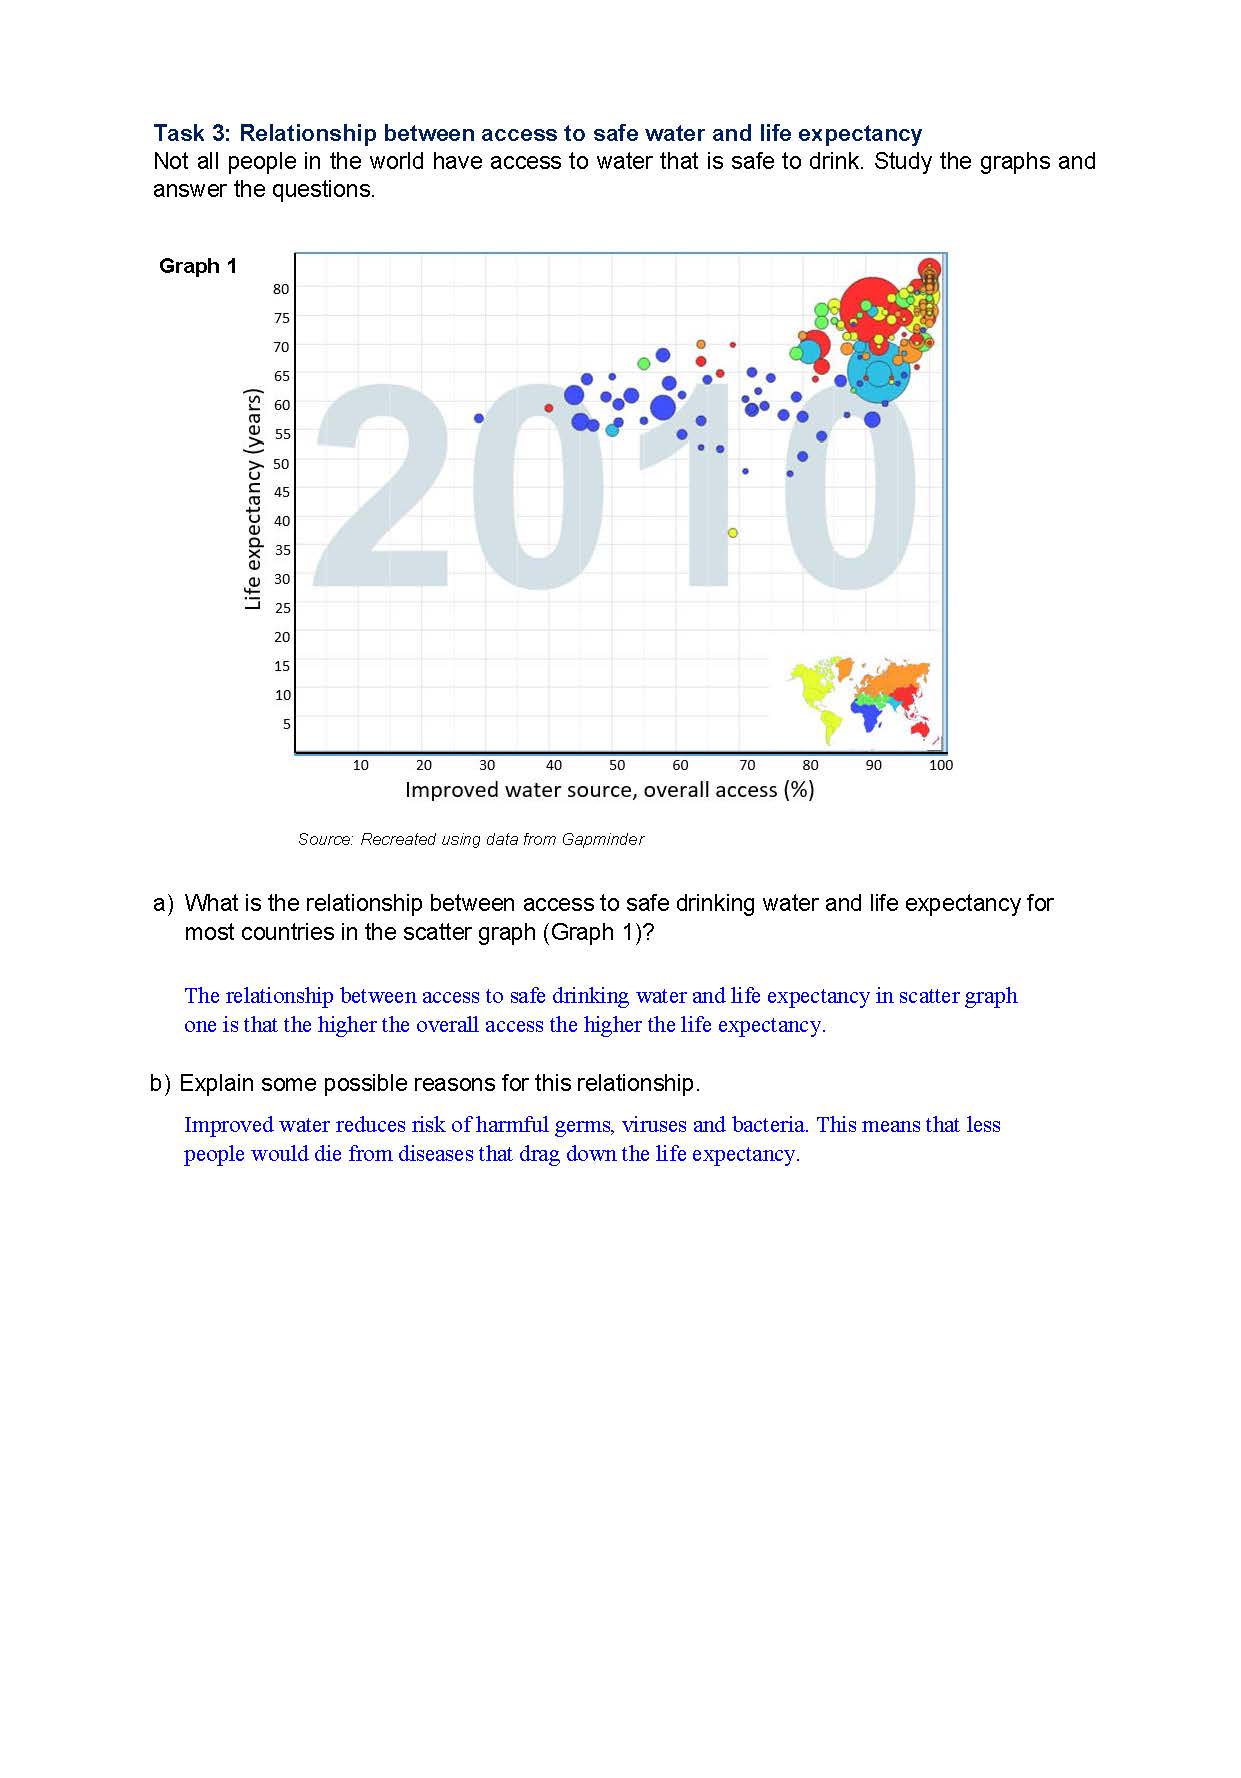
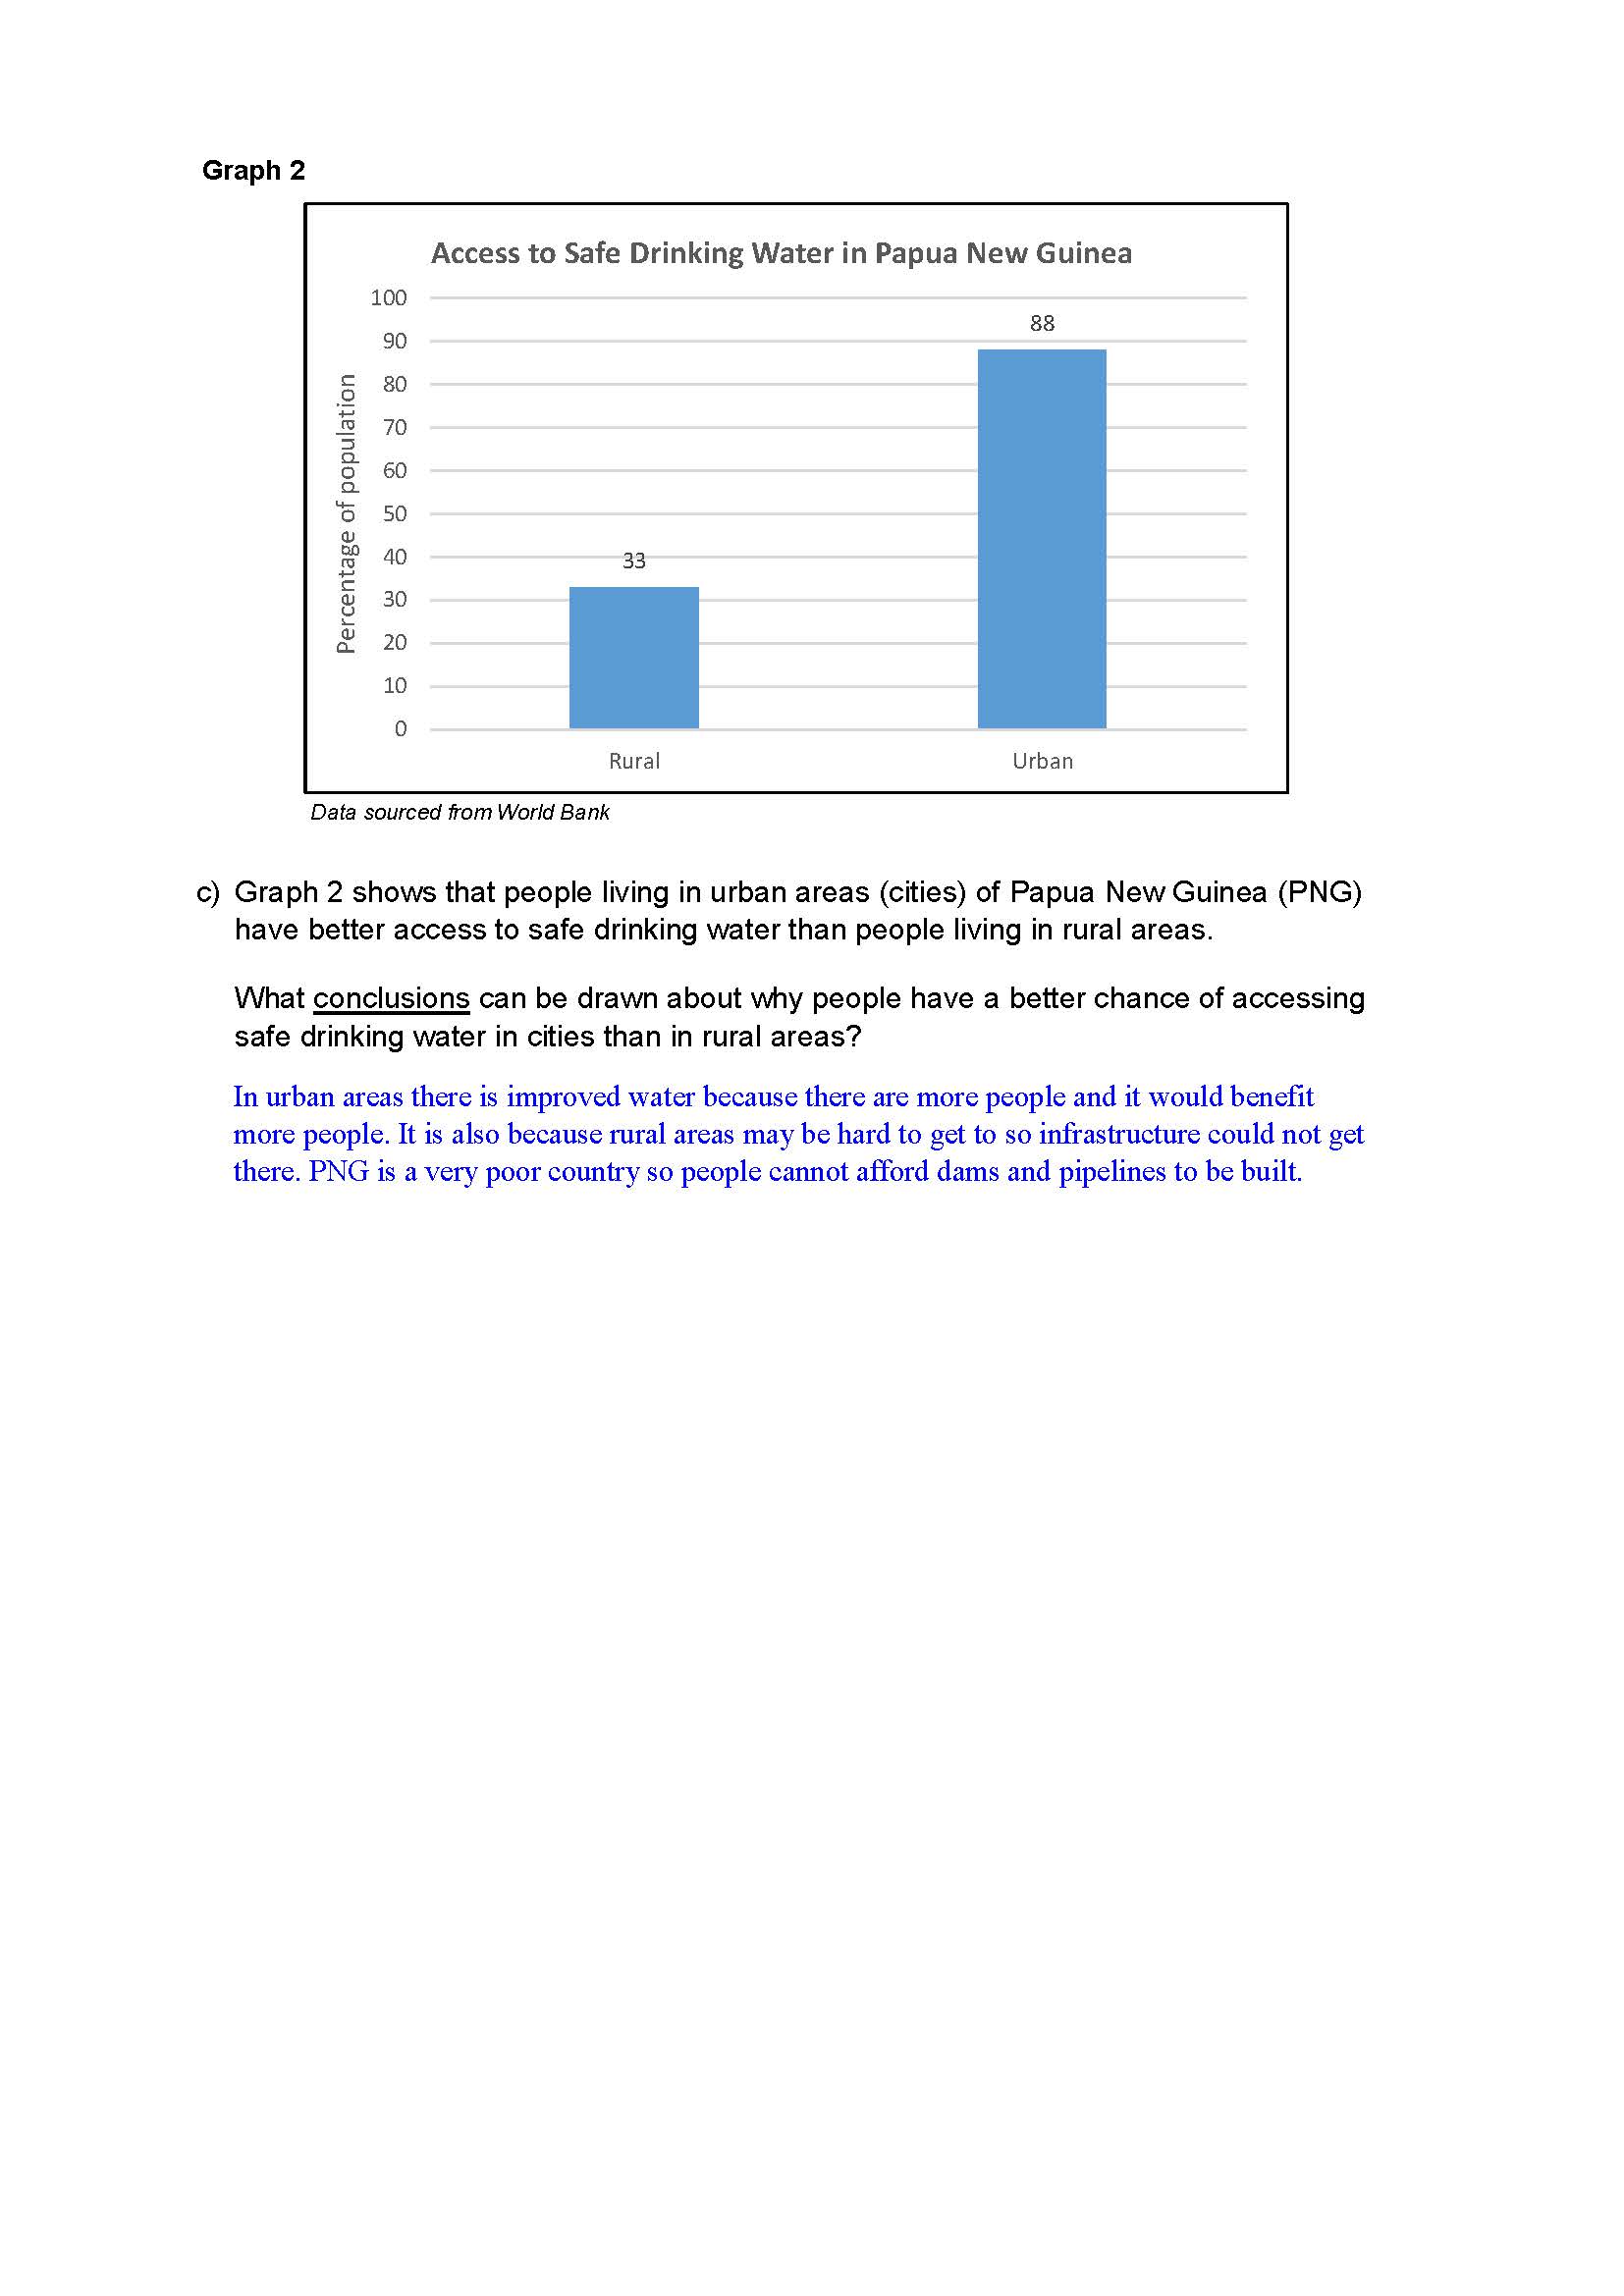
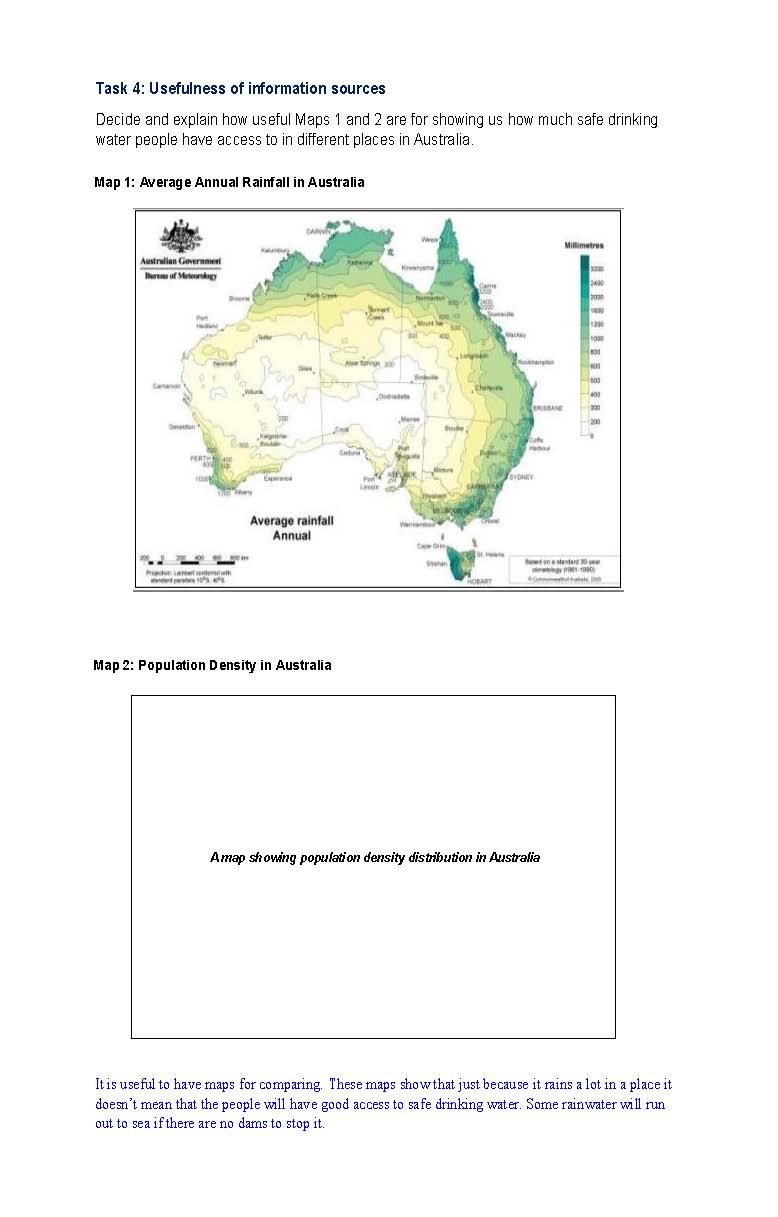
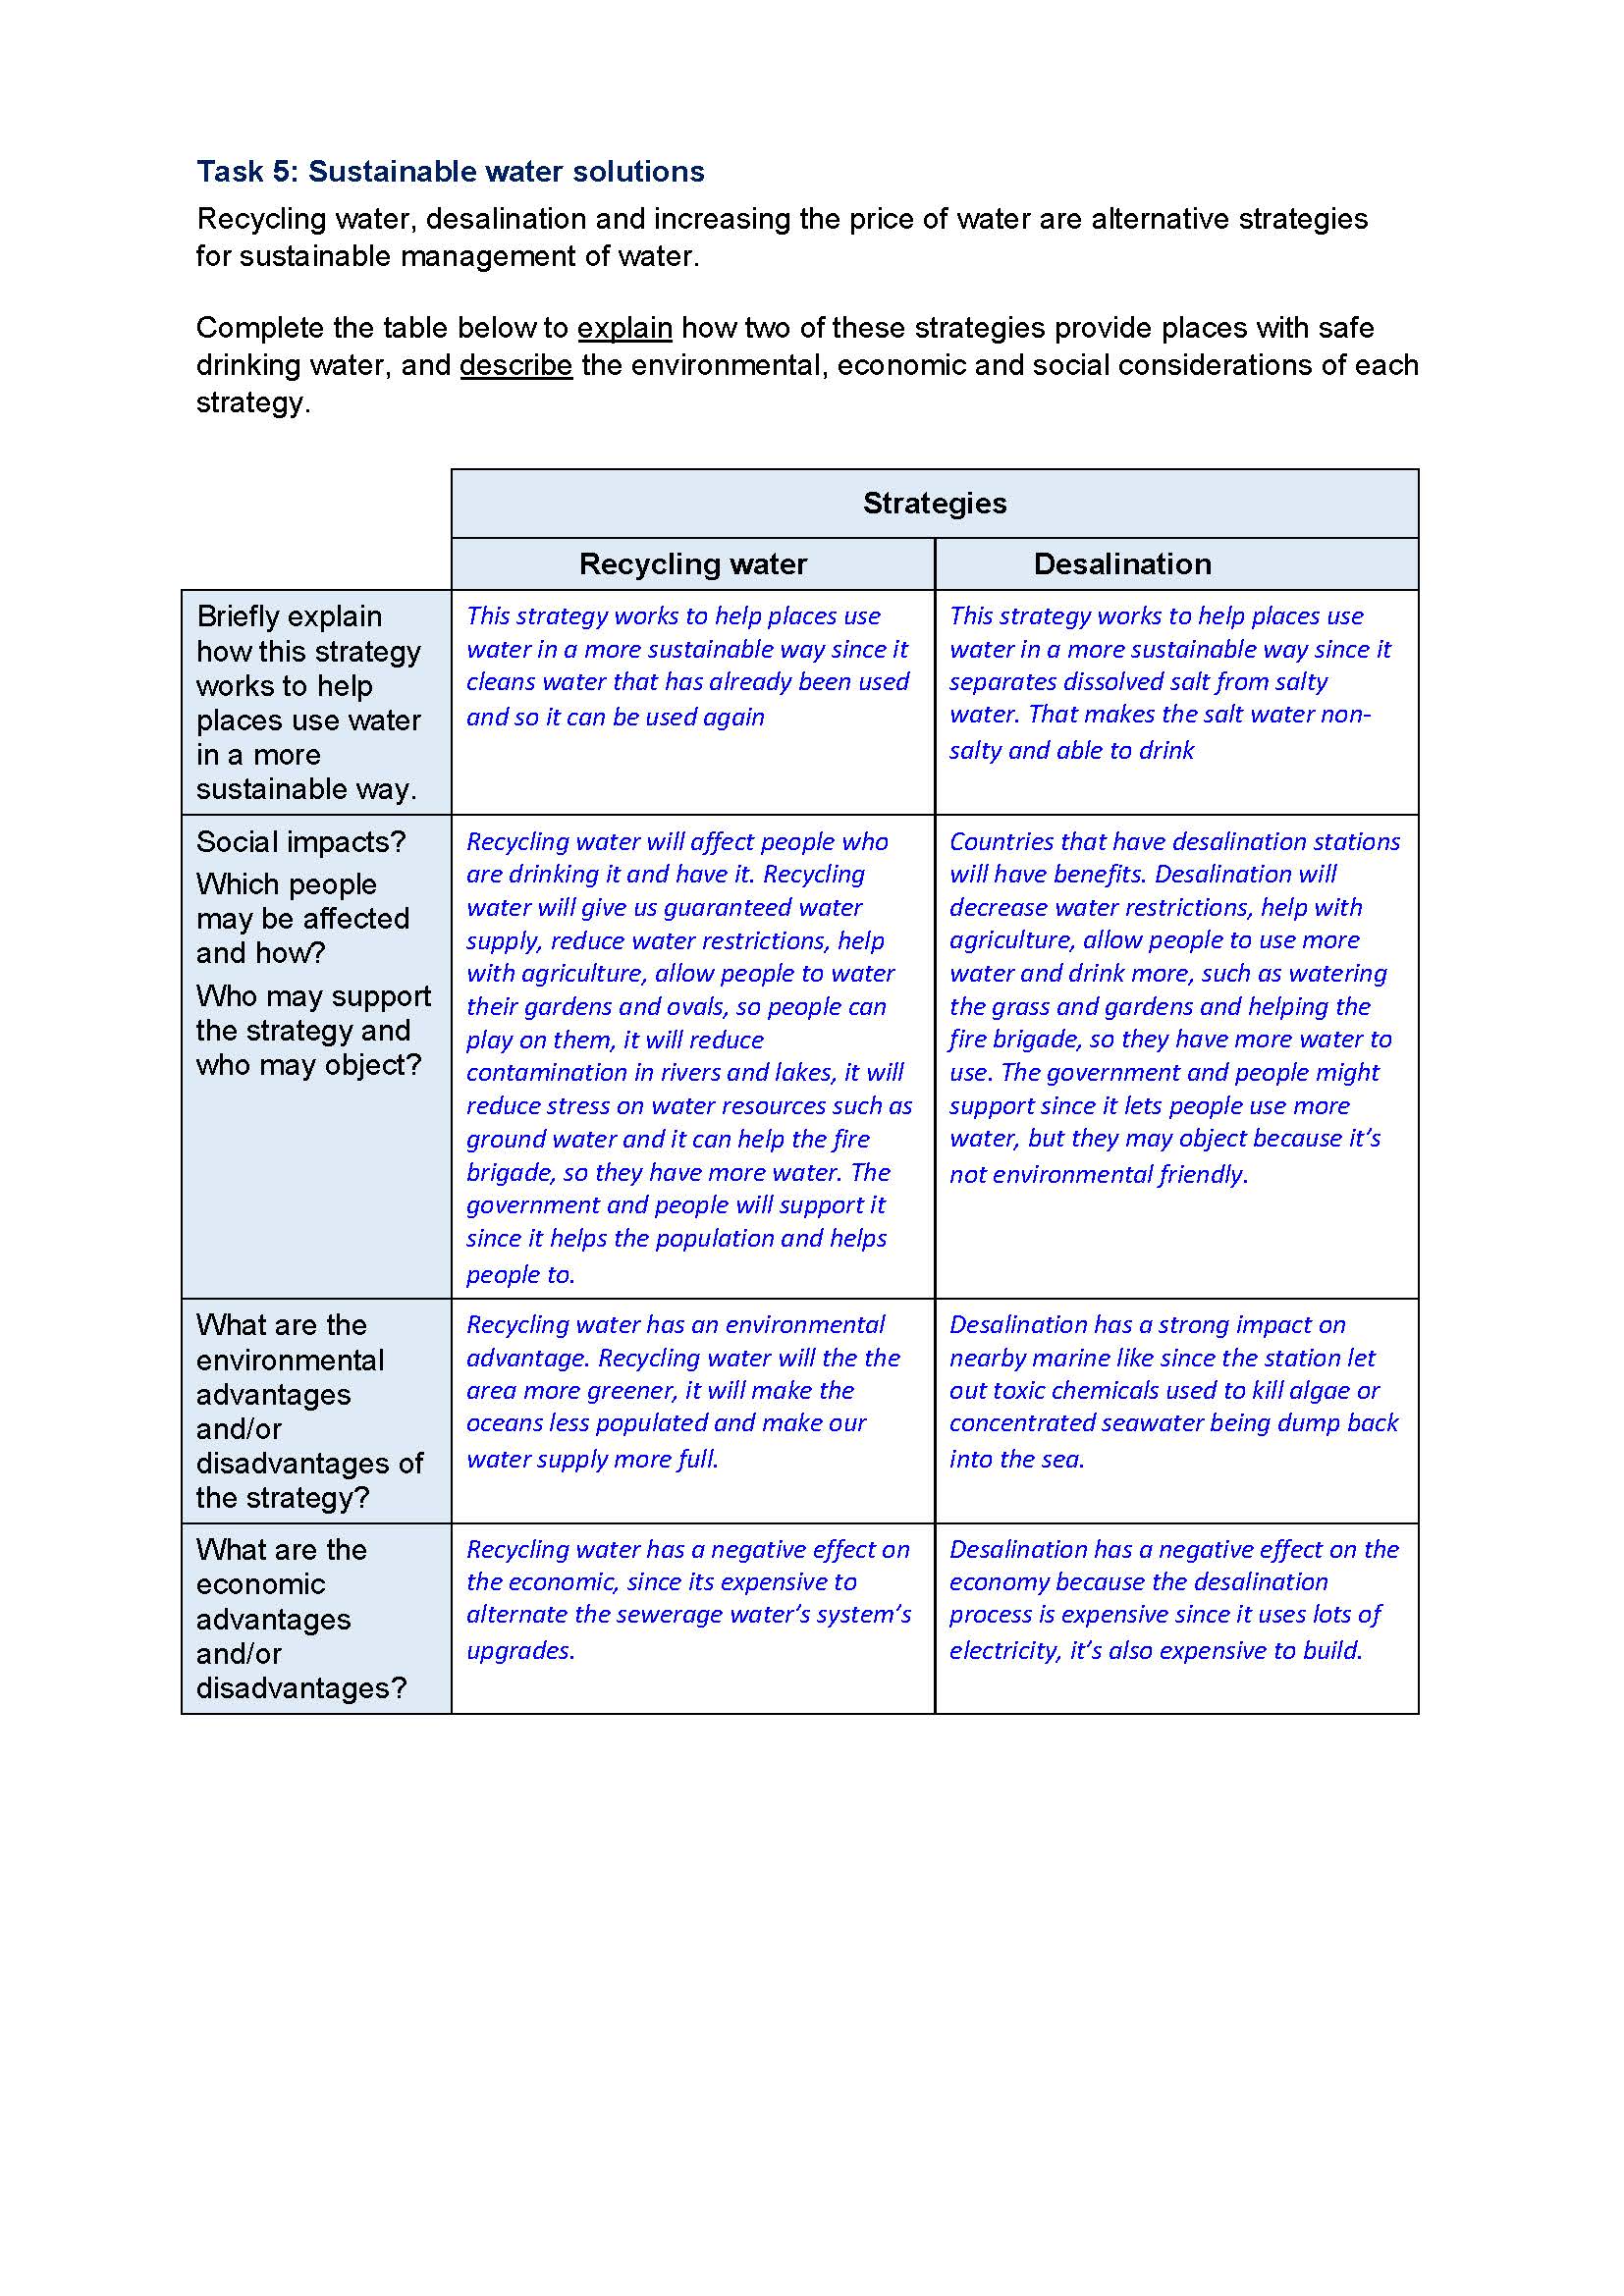
Students explored how water connects places, environments and people. Provided with images, graphs and thematic world maps showing average annual precipitation and access to improved drinking water, students were asked to identify global patterns of average precipitation and access to improved drinking water; describe the relationships between these patterns; and provide reasons for the identified relationships. Students used digital technologies to present the process of orographic rainfall and explain how it influences the characteristics on either side of a mountain. They evaluated the use of maps to understand the limitation of information, and concluded their studies by evaluating the sustainability of alternative strategies for water management. These activities were completed in class over a period of six weeks.
Achievement standard
By the end of Year 7, students describe geographical processes that influence the characteristics of places and how characteristics of places are perceived and valued differently. They explain interconnections between people and places and people and environments and describe how these interconnections change places and environments. They describe alternative strategies for a geographical challenge, referring to environmental, economic and social factors involved.
Students develop geographically significant questions to frame and guide an inquiry process. They locate, collect, organise and categorise useful data and information from a range of primary and secondary sources. They record and represent data and the location and distribution of geographical phenomena in a range of graphic forms, including large-scale and small-scale maps that conform to cartographic conventions. They analyse geographical data and other information to propose simple explanations for spatial patterns, trends and relationships, and draw conclusions. Students present findings and arguments using relevant geographical terminology, digital technologies and graphic representations in a range of communication forms. They propose action in response to a geographical challenge, taking account of environmental, economic and social factors, and describe the expected effects of their proposal.
